Estimated Value: $490,000 - $566,000
4
Beds
3
Baths
2,100
Sq Ft
$252/Sq Ft
Est. Value
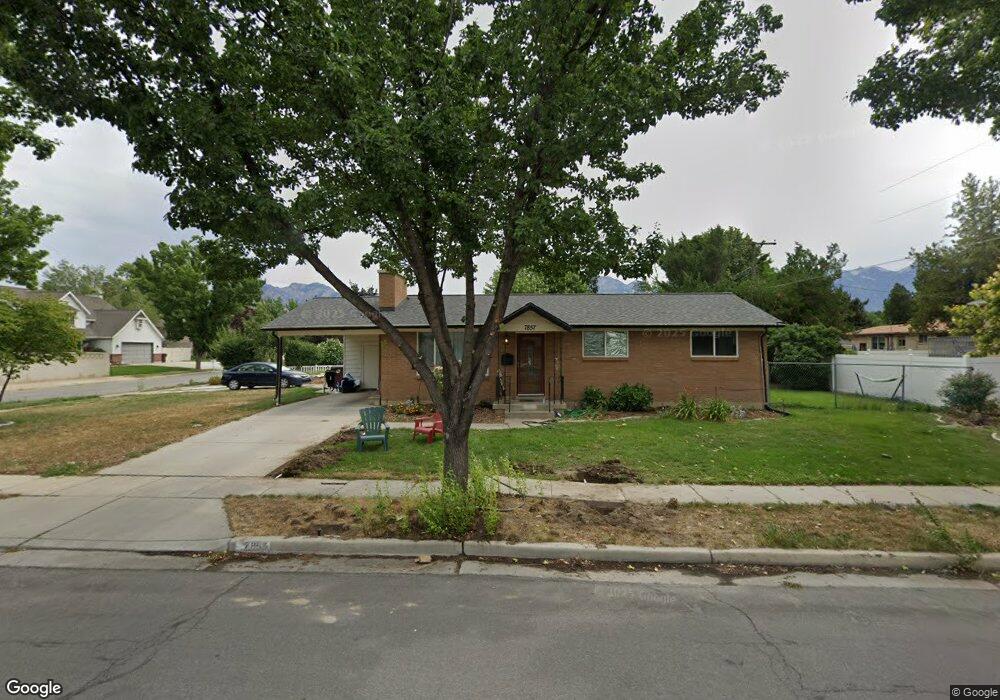
About This Home
This home is located at 7857 S 210 E, Sandy, UT 84070 and is currently estimated at $528,522, approximately $251 per square foot. 7857 S 210 E is a home located in Salt Lake County with nearby schools including Midvalley Elementary School, Union Middle School, and Hillcrest High School.
Ownership History
Date
Name
Owned For
Owner Type
Purchase Details
Closed on
Aug 23, 2019
Sold by
Pimentel Joseph R
Bought by
Pimental Joseph R and Pimentel Elizabeth
Current Estimated Value
Home Financials for this Owner
Home Financials are based on the most recent Mortgage that was taken out on this home.
Original Mortgage
$248,000
Outstanding Balance
$217,202
Interest Rate
3.7%
Mortgage Type
New Conventional
Estimated Equity
$311,320
Purchase Details
Closed on
Aug 22, 2019
Sold by
Morrow Leo William and Morrow Joan J
Bought by
Pimentel Joseph R
Home Financials for this Owner
Home Financials are based on the most recent Mortgage that was taken out on this home.
Original Mortgage
$248,000
Outstanding Balance
$217,202
Interest Rate
3.7%
Mortgage Type
New Conventional
Estimated Equity
$311,320
Purchase Details
Closed on
Feb 28, 2011
Sold by
Morrow Leo William and Morrow Joan J
Bought by
Morrow Leo William and Morrow Joan J
Create a Home Valuation Report for This Property
The Home Valuation Report is an in-depth analysis detailing your home's value as well as a comparison with similar homes in the area
Home Values in the Area
Average Home Value in this Area
Purchase History
| Date | Buyer | Sale Price | Title Company |
|---|---|---|---|
| Pimental Joseph R | -- | Backman Title Services | |
| Pimentel Joseph R | -- | Us Title | |
| Morrow Leo William | -- | None Available |
Source: Public Records
Mortgage History
| Date | Status | Borrower | Loan Amount |
|---|---|---|---|
| Open | Pimentel Joseph R | $248,000 |
Source: Public Records
Tax History
| Year | Tax Paid | Tax Assessment Tax Assessment Total Assessment is a certain percentage of the fair market value that is determined by local assessors to be the total taxable value of land and additions on the property. | Land | Improvement |
|---|---|---|---|---|
| 2025 | $2,785 | $463,700 | $129,300 | $334,400 |
| 2024 | $2,785 | $457,300 | $121,500 | $335,800 |
| 2023 | $2,509 | $408,100 | $115,500 | $292,600 |
| 2022 | $2,632 | $418,200 | $113,300 | $304,900 |
| 2021 | $2,351 | $319,500 | $98,500 | $221,000 |
| 2020 | $2,232 | $287,000 | $79,800 | $207,200 |
| 2019 | $2,103 | $263,400 | $79,800 | $183,600 |
| 2016 | $1,777 | $209,800 | $70,900 | $138,900 |
Source: Public Records
Map
Nearby Homes
- 7824 S 280 E
- 190 E White Spruce Cove Unit 805
- 135 E Station St
- 379 E Horse Creek Dr
- 397 E Tractor Dr Unit 103
- 393 E Corral Creek Dr
- 257 E Water Mill Way
- 257 Water Mill Way Unit 211
- 274 E Water Mill Way Unit 230
- 7359 S Dewmar Ct W Unit 32
- 489 E 7800 S Unit 2
- 7363 S Dewmar Ct W Unit 33
- 7342 S Seven Tree Ln W Unit 77
- 7329 S Seven Tree Ln W Unit 85
- 7371 S Dewmar Ct W Unit 35
- 7327 S Seven Tree Ln W Unit 86
- 7337 S Seven Tree Ln W Unit 82
- 7343 S Seven Tree Ln Unit 79
- 7355 S Dewmar Ct W Unit 31
- 330 E 7635 S Unit 344
Your Personal Tour Guide
Ask me questions while you tour the home.