Estimated Value: $175,000 - $227,198
4
Beds
3
Baths
1,456
Sq Ft
$138/Sq Ft
Est. Value
About This Home
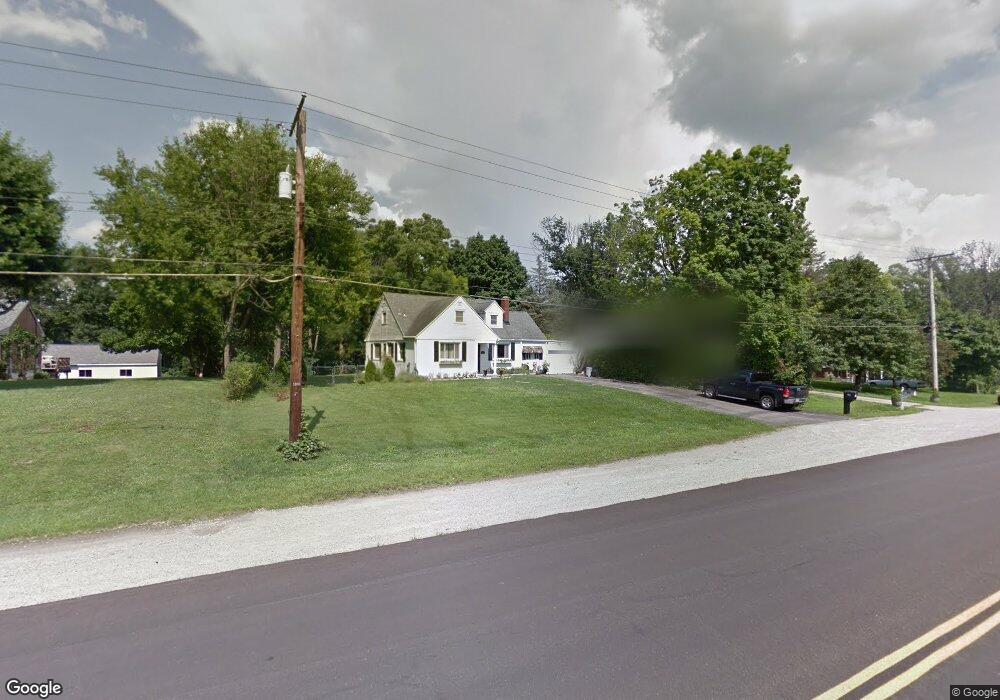
This home is located at 786 Dayton Xenia Rd, Xenia, OH 45385 and is currently estimated at $201,550, approximately $138 per square foot. 786 Dayton Xenia Rd is a home located in Greene County with nearby schools including Xenia High School and Summit Academy Community School for Alternative Learners - Xenia.
Ownership History
Date
Name
Owned For
Owner Type
Purchase Details
Closed on
Jan 8, 2021
Sold by
Baker Whitney A and Baker Christopher R
Bought by
Baker Christopher R
Current Estimated Value
Home Financials for this Owner
Home Financials are based on the most recent Mortgage that was taken out on this home.
Original Mortgage
$92,000
Outstanding Balance
$82,110
Interest Rate
2.71%
Mortgage Type
New Conventional
Estimated Equity
$119,440
Purchase Details
Closed on
Jun 25, 2009
Sold by
Stames Riley C
Bought by
Ballmer Whitney A
Home Financials for this Owner
Home Financials are based on the most recent Mortgage that was taken out on this home.
Original Mortgage
$115,862
Interest Rate
4.92%
Mortgage Type
FHA
Purchase Details
Closed on
Sep 19, 1995
Sold by
Brewer Alice
Bought by
Starnes Riley C and Starnes Lorene
Create a Home Valuation Report for This Property
The Home Valuation Report is an in-depth analysis detailing your home's value as well as a comparison with similar homes in the area
Home Values in the Area
Average Home Value in this Area
Purchase History
| Date | Buyer | Sale Price | Title Company |
|---|---|---|---|
| Baker Christopher R | $115,000 | Agility Closing & Ttl Svcs I | |
| Ballmer Whitney A | $118,000 | Attorney | |
| Starnes Riley C | $86,000 | -- |
Source: Public Records
Mortgage History
| Date | Status | Borrower | Loan Amount |
|---|---|---|---|
| Open | Baker Christopher R | $92,000 | |
| Previous Owner | Ballmer Whitney A | $115,862 |
Source: Public Records
Tax History Compared to Growth
Tax History
| Year | Tax Paid | Tax Assessment Tax Assessment Total Assessment is a certain percentage of the fair market value that is determined by local assessors to be the total taxable value of land and additions on the property. | Land | Improvement |
|---|---|---|---|---|
| 2024 | $3,011 | $61,940 | $8,750 | $53,190 |
| 2023 | $3,011 | $61,940 | $8,750 | $53,190 |
| 2022 | $2,581 | $48,130 | $7,660 | $40,470 |
| 2021 | $2,614 | $48,130 | $7,660 | $40,470 |
| 2020 | $2,512 | $48,130 | $7,660 | $40,470 |
| 2019 | $2,170 | $39,040 | $7,660 | $31,380 |
| 2018 | $2,178 | $39,040 | $7,660 | $31,380 |
| 2017 | $2,344 | $39,040 | $7,660 | $31,380 |
| 2016 | $2,345 | $41,320 | $7,660 | $33,660 |
| 2015 | $2,351 | $41,320 | $7,660 | $33,660 |
| 2014 | $2,257 | $41,320 | $7,660 | $33,660 |
Source: Public Records
Map
Nearby Homes
- 121 S Progress Dr
- 2105 Drake Dr
- Harmony Plan at Grandstone Trace
- Newcastle Plan at Grandstone Trace
- Pendleton Plan at Grandstone Trace
- Bellamy Plan at Grandstone Trace
- Chatham Plan at Grandstone Trace
- 532 Hollywood Blvd
- 523 Hollywood Blvd
- 343 Sheelin Rd
- 517 Hollywood Blvd
- 1391 June Dr
- 1814 Palmer Ct
- 1808 Palmer Ct
- 1820 Palmer Ct
- 1802 Palmer Ct
- 1796 Palmer Ct
- 1283 June Dr
- 912 Omard Dr
- 1223 June Dr
- 796 Dayton Xenia Rd
- 776 Dayton Xenia Rd
- 776 Dayton Xenia Rd
- 770 Dayton Xenia Rd
- 810 Dayton Xenia Rd
- 740 Dayton Xenia Rd
- 740 Dayton Xenia Rd
- 760 Dayton Xenia Rd
- 820 Dayton Xenia Rd
- 820 Dayton Xenia Rd
- 860 Dayton Xenia Rd
- 842 Dayton Xenia Rd
- 870 Dayton Xenia Rd
- 880 Dayton Xenia Rd
- 815 Dayton Xenia Rd
- 902 Dayton Xenia Rd
- 710 Hawkins Rd
- 671 Hawkins School House Rd
- 718 Hawkins Rd
- 730 Hawkins Rd