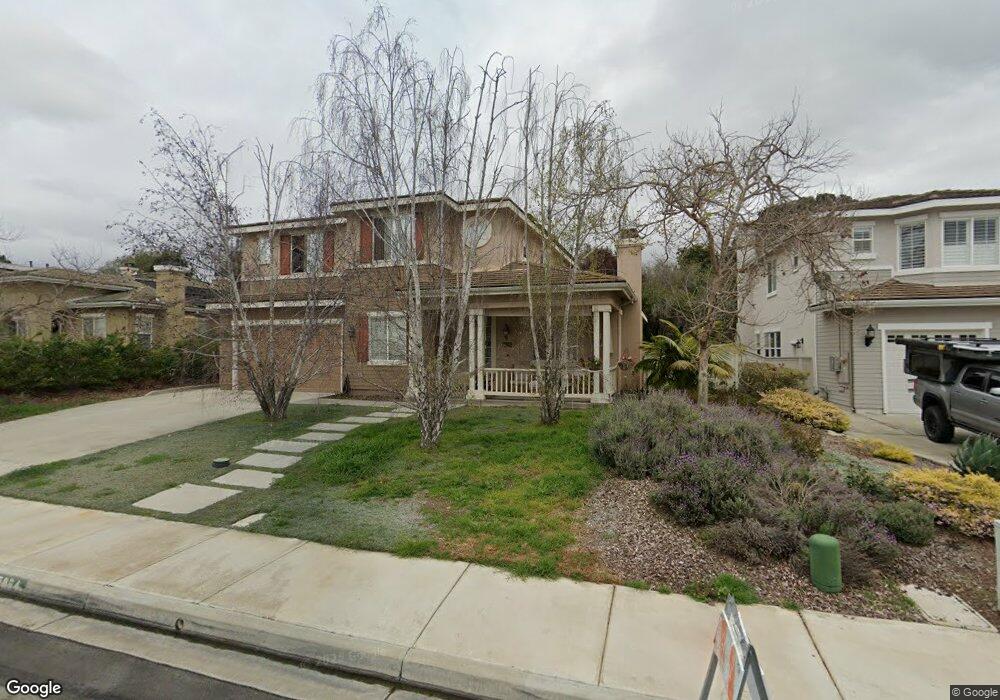
7864 Via Teca Carlsbad, CA 92009
La Costa NeighborhoodEstimated Value: $1,917,000 - $2,284,000
4
Beds
4
Baths
3,305
Sq Ft
$655/Sq Ft
Est. Value
About This Home
This home is located at 7864 Via Teca, Carlsbad, CA 92009 and is currently estimated at $2,163,744, approximately $654 per square foot. 7864 Via Teca is a home located in San Diego County with nearby schools including La Costa Heights Elementary School, Oak Crest Middle School, and La Costa Canyon High School.
Ownership History
Date
Name
Owned For
Owner Type
Purchase Details
Closed on
Mar 28, 2025
Sold by
Kirkland John R
Bought by
Taylor Christopher and Kirkland Julia
Current Estimated Value
Home Financials for this Owner
Home Financials are based on the most recent Mortgage that was taken out on this home.
Original Mortgage
$650,000
Outstanding Balance
$645,938
Interest Rate
6.65%
Mortgage Type
New Conventional
Estimated Equity
$1,517,806
Purchase Details
Closed on
Jul 3, 2000
Sold by
K Hovnanian At Arbor Heights Llc
Bought by
Kirkland John R and Kirkland Gene Y C
Home Financials for this Owner
Home Financials are based on the most recent Mortgage that was taken out on this home.
Original Mortgage
$350,000
Interest Rate
8.2%
Create a Home Valuation Report for This Property
The Home Valuation Report is an in-depth analysis detailing your home's value as well as a comparison with similar homes in the area
Home Values in the Area
Average Home Value in this Area
Purchase History
| Date | Buyer | Sale Price | Title Company |
|---|---|---|---|
| Taylor Christopher | $1,900,000 | Wfg National Title Company | |
| Kirkland John R | $518,000 | First American Title |
Source: Public Records
Mortgage History
| Date | Status | Borrower | Loan Amount |
|---|---|---|---|
| Open | Taylor Christopher | $650,000 | |
| Previous Owner | Kirkland John R | $350,000 |
Source: Public Records
Tax History Compared to Growth
Tax History
| Year | Tax Paid | Tax Assessment Tax Assessment Total Assessment is a certain percentage of the fair market value that is determined by local assessors to be the total taxable value of land and additions on the property. | Land | Improvement |
|---|---|---|---|---|
| 2025 | $9,441 | $780,376 | $316,428 | $463,948 |
| 2024 | $9,441 | $765,075 | $310,224 | $454,851 |
| 2023 | $9,196 | $750,075 | $304,142 | $445,933 |
| 2022 | $8,998 | $735,369 | $298,179 | $437,190 |
| 2021 | $8,863 | $720,951 | $292,333 | $428,618 |
| 2020 | $8,733 | $713,560 | $289,336 | $424,224 |
| 2019 | $8,575 | $699,569 | $283,663 | $415,906 |
| 2018 | $8,440 | $685,852 | $278,101 | $407,751 |
| 2017 | $8,308 | $672,405 | $272,649 | $399,756 |
| 2016 | $8,077 | $659,221 | $267,303 | $391,918 |
| 2015 | $7,948 | $649,320 | $263,288 | $386,032 |
| 2014 | $7,784 | $636,602 | $258,131 | $378,471 |
Source: Public Records
Map
Nearby Homes
- 3101 Levante St
- 3008 Garboso St
- 2606 Galicia Way
- 8010 Calle Pinon
- 2639 Pirineos Way Unit 231
- 7523 Quinta St
- 7508 Jerez Ct
- 2630 Pirineos Way Unit 5
- 2630 Pirineos Way Unit 4
- 2630 Pirineos Way Unit 14
- 3109 Madera Ct
- 7500 Viejo Castilla Way Unit 9
- 7925 Calle Madrid
- 2533 Navarra Dr Unit 2A
- 2537 Navarra Dr Unit B9
- 7941 Calle Madrid Unit 4
- 2552 Navarra Dr Unit A
- 3112 Del Rey Ave
- 2204 Recodo Ct
- 2507 Navarra Dr Unit 202
- 7860 Via Teca
- 7868 Via Teca
- 7815 Gabacho St
- 7817 Gabacho St
- 7872 Via Teca
- 7856 Via Teca
- 7813 Gabacho St
- 7819 Gabacho St
- 7865 Via Teca
- 2895 Corte Morera
- 7869 Via Teca
- 7811 Gabacho St
- 7873 Via Teca
- 7852 Via Teca
- 2891 Corte Morera
- 7862 Sitio Fresno
- 2898 Corte Morera
- 2921 Segovia Way
- 7866 Sitio Fresno
- 2917 Segovia Way