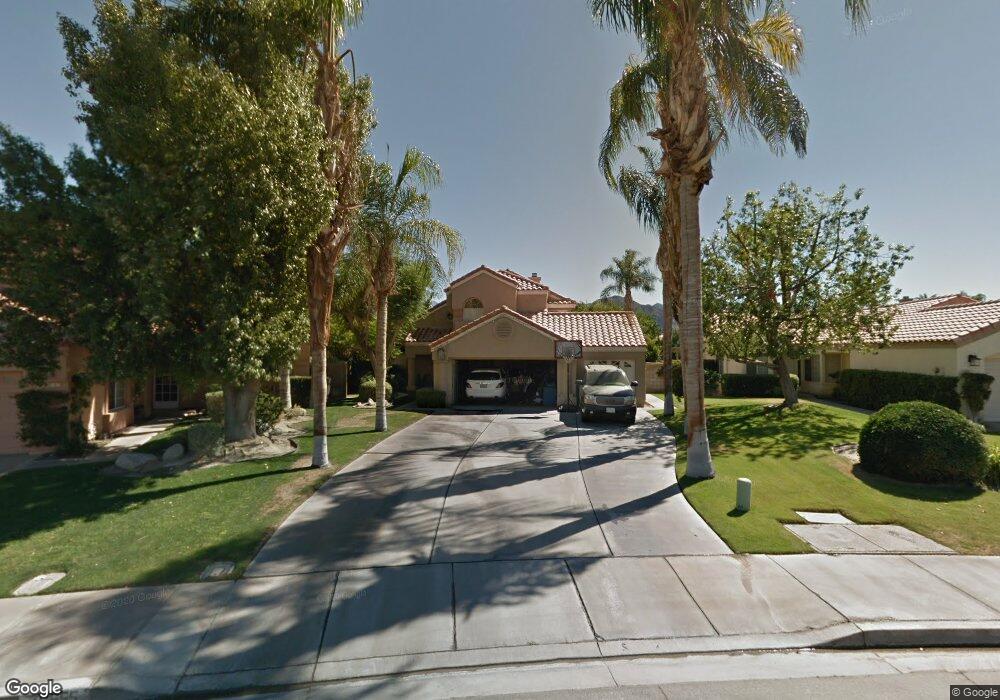
78655 Villeta Dr La Quinta, CA 92253
Estimated Value: $479,000 - $679,000
4
Beds
3
Baths
2,295
Sq Ft
$253/Sq Ft
Est. Value
About This Home
This home is located at 78655 Villeta Dr, La Quinta, CA 92253 and is currently estimated at $579,984, approximately $252 per square foot. 78655 Villeta Dr is a home located in Riverside County with nearby schools including Gerald R. Ford Elementary School, John Glenn Middle School Of International Studies, and La Quinta High School.
Ownership History
Date
Name
Owned For
Owner Type
Purchase Details
Closed on
Oct 2, 2024
Sold by
Morse Family Trust and Morse Patrick R
Bought by
Mooney Kristopher J and Garban Jihan
Current Estimated Value
Home Financials for this Owner
Home Financials are based on the most recent Mortgage that was taken out on this home.
Original Mortgage
$451,250
Outstanding Balance
$443,800
Interest Rate
6.35%
Mortgage Type
New Conventional
Estimated Equity
$136,184
Purchase Details
Closed on
Jul 9, 2010
Sold by
Morse Patrick R
Bought by
Morse Patrick R and Morse Kathryne P
Purchase Details
Closed on
Mar 28, 2001
Sold by
Morse Patrick Robert
Bought by
Morse Patrick R
Purchase Details
Closed on
Jan 25, 2000
Sold by
Speach Darryl M and Speach Laura M
Bought by
Morse Patrick Robert
Home Financials for this Owner
Home Financials are based on the most recent Mortgage that was taken out on this home.
Original Mortgage
$148,850
Interest Rate
8.16%
Mortgage Type
Purchase Money Mortgage
Create a Home Valuation Report for This Property
The Home Valuation Report is an in-depth analysis detailing your home's value as well as a comparison with similar homes in the area
Purchase History
| Date | Buyer | Sale Price | Title Company |
|---|---|---|---|
| Mooney Kristopher J | $475,000 | Corinthian Title | |
| Morse Patrick R | -- | None Available | |
| Morse Patrick R | -- | -- | |
| Morse Patrick Robert | $186,500 | First American Title Co |
Source: Public Records
Mortgage History
| Date | Status | Borrower | Loan Amount |
|---|---|---|---|
| Open | Mooney Kristopher J | $451,250 | |
| Previous Owner | Morse Patrick Robert | $148,850 |
Source: Public Records
Tax History
| Year | Tax Paid | Tax Assessment Tax Assessment Total Assessment is a certain percentage of the fair market value that is determined by local assessors to be the total taxable value of land and additions on the property. | Land | Improvement |
|---|---|---|---|---|
| 2025 | $4,188 | $585,000 | $169,998 | $415,002 |
| 2023 | $4,188 | $274,896 | $73,851 | $201,045 |
| 2022 | $3,915 | $269,506 | $72,403 | $197,103 |
| 2021 | $3,814 | $264,223 | $70,984 | $193,239 |
| 2020 | $3,747 | $261,515 | $70,257 | $191,258 |
| 2019 | $3,672 | $256,388 | $68,880 | $187,508 |
| 2018 | $3,593 | $251,362 | $67,531 | $183,831 |
| 2017 | $3,535 | $246,434 | $66,207 | $180,227 |
| 2016 | $3,465 | $241,603 | $64,909 | $176,694 |
| 2015 | $3,475 | $237,976 | $63,935 | $174,041 |
| 2014 | $3,335 | $233,317 | $62,684 | $170,633 |
Source: Public Records
Map
Nearby Homes
- 78585 Villeta Dr
- 78715 Naples Dr
- 78487 Magenta Dr
- 78805 La Palma Dr
- 78721 Siena Ct
- 78870 Meridian Way
- 78500 Via Palomino
- 78431 Magenta Dr
- 78663 Como Ct
- 78379 Terra Cotta Ct Unit 109
- 78373 Terra Cotta Ct Unit 106
- 78670 Bradford Cir
- 78707 Torino Dr
- 78357 Terra Cotta Ct
- 78440 Via Palomino
- 78313 Scarlet Ct
- 78303 Scarlet Ct
- 78895 Galaxy Dr
- 44850 Via Catalina
- 44875 Via Catalina
- 78645 Villeta Dr
- 78665 Villeta Dr
- 78675 Villeta Dr
- 44340 Villeta Dr
- 44350 Villeta Dr
- 44265 Las Vistas Dr
- 44330 Villeta Dr
- 44320 Villeta Dr
- 78625 Villeta Dr
- 44295 Las Vistas Dr
- 78670 Villeta Dr
- 44150 Cristol Place
- 44325 Las Vistas Dr
- 78615 Villeta Dr
- 78705 Villeta Dr
- 44300 Villeta Dr
- 44120 Cristol Place
- 44370 Villeta Dr
- 44315 Villeta Dr
- 44355 Las Vistas Dr
Your Personal Tour Guide
Ask me questions while you tour the home.