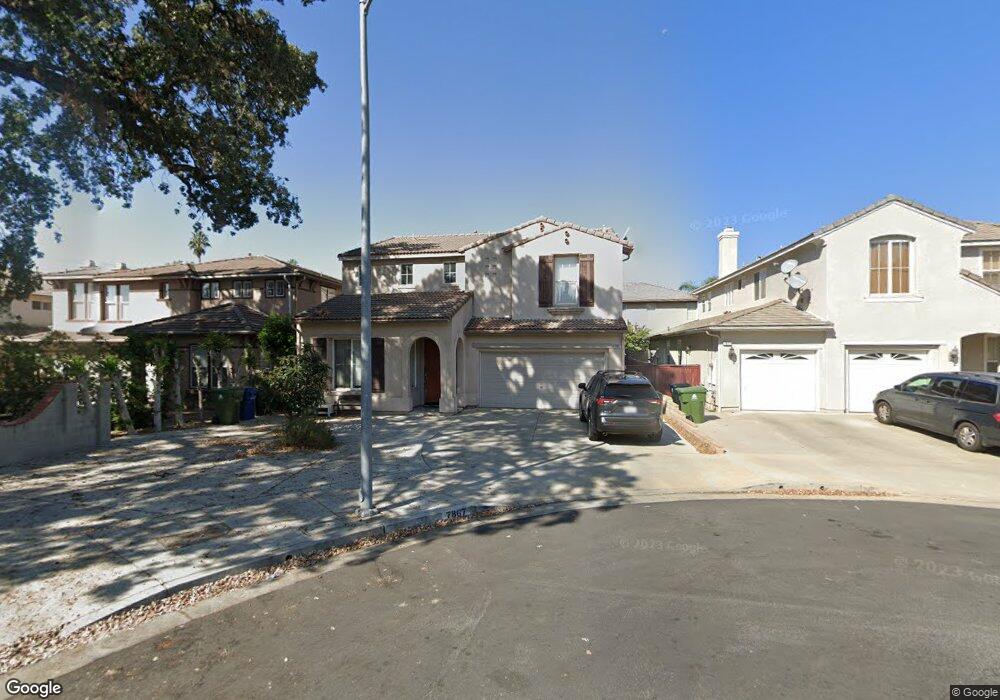
7867 Laramie Ave Winnetka, CA 91306
Estimated Value: $985,000 - $1,126,000
3
Beds
3
Baths
2,828
Sq Ft
$371/Sq Ft
Est. Value
About This Home
This home is located at 7867 Laramie Ave, Winnetka, CA 91306 and is currently estimated at $1,048,606, approximately $370 per square foot. 7867 Laramie Ave is a home located in Los Angeles County with nearby schools including Winnetka Avenue Elementary School, John A. Sutter Middle School, and Northridge Academy High.
Ownership History
Date
Name
Owned For
Owner Type
Purchase Details
Closed on
Aug 14, 2019
Sold by
Cassis Salime
Bought by
Soraya Cassis Living Trust
Current Estimated Value
Purchase Details
Closed on
Aug 29, 2007
Sold by
Cassis Salime Chaya and Cassis George
Bought by
Cassis Salime Chaya
Home Financials for this Owner
Home Financials are based on the most recent Mortgage that was taken out on this home.
Original Mortgage
$50,000
Outstanding Balance
$31,818
Interest Rate
6.67%
Mortgage Type
Credit Line Revolving
Estimated Equity
$1,016,788
Purchase Details
Closed on
Mar 27, 2001
Sold by
Premier Winnetka Ltd
Bought by
Cassis George and Cassis Salime Chaya
Purchase Details
Closed on
Aug 9, 2000
Sold by
Premier Winnetka Ltd
Bought by
Luong Kien and Luong Anna
Home Financials for this Owner
Home Financials are based on the most recent Mortgage that was taken out on this home.
Original Mortgage
$257,600
Interest Rate
6.89%
Create a Home Valuation Report for This Property
The Home Valuation Report is an in-depth analysis detailing your home's value as well as a comparison with similar homes in the area
Home Values in the Area
Average Home Value in this Area
Purchase History
| Date | Buyer | Sale Price | Title Company |
|---|---|---|---|
| Soraya Cassis Living Trust | -- | None Available | |
| Cassis Salime Chaya | -- | Multiple | |
| Cassis George | $339,000 | First American Title Co | |
| Luong Kien | $327,000 | First American Title Co |
Source: Public Records
Mortgage History
| Date | Status | Borrower | Loan Amount |
|---|---|---|---|
| Open | Cassis Salime Chaya | $50,000 | |
| Previous Owner | Luong Kien | $257,600 |
Source: Public Records
Tax History Compared to Growth
Tax History
| Year | Tax Paid | Tax Assessment Tax Assessment Total Assessment is a certain percentage of the fair market value that is determined by local assessors to be the total taxable value of land and additions on the property. | Land | Improvement |
|---|---|---|---|---|
| 2025 | $6,458 | $510,796 | $209,891 | $300,905 |
| 2024 | $6,458 | $500,781 | $205,776 | $295,005 |
| 2023 | $6,336 | $490,963 | $201,742 | $289,221 |
| 2022 | $6,094 | $481,337 | $197,787 | $283,550 |
| 2021 | $5,956 | $471,900 | $193,909 | $277,991 |
| 2020 | $5,926 | $467,062 | $191,921 | $275,141 |
| 2019 | $5,697 | $457,905 | $188,158 | $269,747 |
| 2018 | $5,597 | $448,927 | $184,469 | $264,458 |
| 2016 | $5,322 | $431,496 | $177,306 | $254,190 |
| 2015 | $5,245 | $425,015 | $174,643 | $250,372 |
| 2014 | $5,265 | $416,690 | $171,222 | $245,468 |
Source: Public Records
Map
Nearby Homes
- 7936 Laramie Ave
- 7933 Casaba Ave
- 20252 Lorne St
- 7826 Winnetka Ave
- 7800 Winnetka Ave
- 20028 Strathern St
- 20254 Stagg St
- 20329 Stagg St
- 20323 Lorne St
- 20253 Keswick St Unit 326
- 20253 Keswick St Unit 105
- 20155 Keswick St Unit 112
- 20155 Keswick St Unit 209
- 20235 Keswick St Unit 102
- 20234 Cantara St Unit 269
- 20234 Cantara St Unit 143
- 20234 Cantara St Unit 107
- 7640 Oso Ave Unit 316
- 7640 Oso Ave Unit 217
- 20431 Stagg St
- 7861 Laramie Ave
- 7871 Laramie Ave
- 20220 Hemmingway St
- 7857 Laramie Ave
- 20226 Hemmingway St
- 20215 Arminta St
- 7851 Laramie Ave
- 7862 Laramie Ave
- 7868 Laramie Ave
- 7874 Laramie Ave
- 20225 Arminta St
- 20230 Hemmingway St
- 20217 Hemmingway St
- 20211 Hemmingway St
- 7856 Laramie Ave
- 20221 Hemmingway St
- 20205 Hemmingway St
- 20235 Arminta St
- 20225 Hemmingway St
- 7850 Laramie Ave