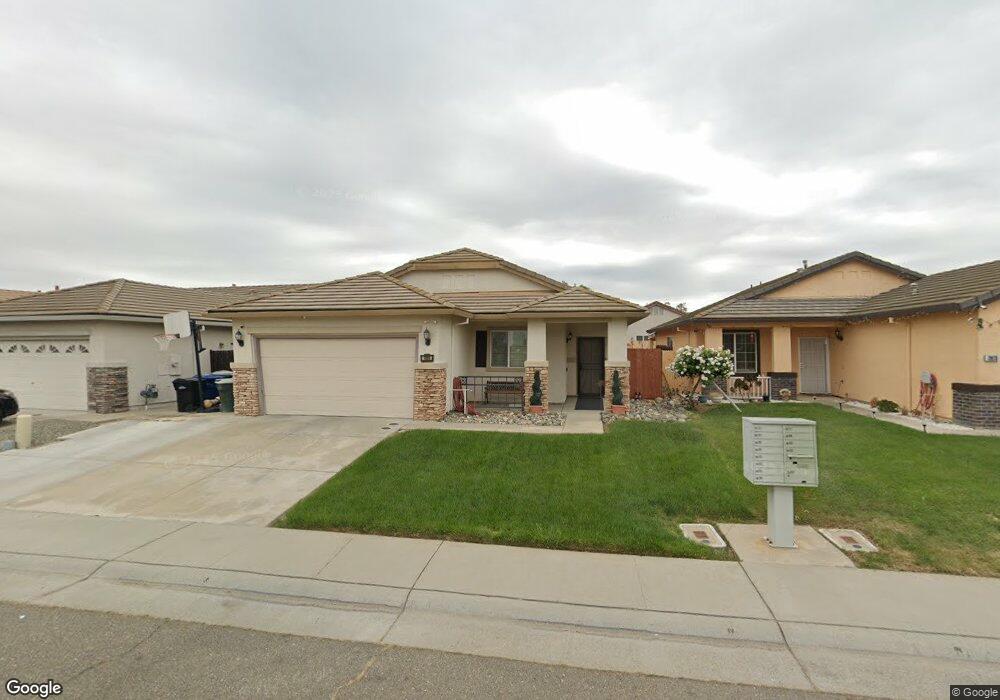
7869 Dersingham Dr Sacramento, CA 95829
Estimated Value: $411,000 - $570,000
4
Beds
2
Baths
1,577
Sq Ft
$329/Sq Ft
Est. Value
About This Home
This home is located at 7869 Dersingham Dr, Sacramento, CA 95829 and is currently estimated at $519,559, approximately $329 per square foot. 7869 Dersingham Dr is a home located in Sacramento County with nearby schools including Maeola E. Beitzel Elementary School, T. R. Smedberg Middle School, and Sheldon High School.
Ownership History
Date
Name
Owned For
Owner Type
Purchase Details
Closed on
Feb 14, 2005
Sold by
Scott Jermon
Bought by
Carter Leslie D
Current Estimated Value
Home Financials for this Owner
Home Financials are based on the most recent Mortgage that was taken out on this home.
Original Mortgage
$284,000
Outstanding Balance
$141,973
Interest Rate
5.5%
Mortgage Type
Purchase Money Mortgage
Estimated Equity
$377,587
Purchase Details
Closed on
Jan 14, 2003
Sold by
Elliott Homes Inc
Bought by
Finato Aaron M and Hayes Dustin N
Home Financials for this Owner
Home Financials are based on the most recent Mortgage that was taken out on this home.
Original Mortgage
$226,526
Interest Rate
6.15%
Mortgage Type
FHA
Create a Home Valuation Report for This Property
The Home Valuation Report is an in-depth analysis detailing your home's value as well as a comparison with similar homes in the area
Home Values in the Area
Average Home Value in this Area
Purchase History
| Date | Buyer | Sale Price | Title Company |
|---|---|---|---|
| Carter Leslie D | -- | First American Title Co | |
| Carter Leslie D | $355,000 | First American Title Co | |
| Finato Aaron M | $230,000 | Stewart Title Of Sacramento | |
| Elliott Homes Inc | $24,000 | Stewart Title Of Sacramento |
Source: Public Records
Mortgage History
| Date | Status | Borrower | Loan Amount |
|---|---|---|---|
| Open | Carter Leslie D | $284,000 | |
| Previous Owner | Elliott Homes Inc | $226,526 | |
| Closed | Carter Leslie D | $71,000 |
Source: Public Records
Tax History Compared to Growth
Tax History
| Year | Tax Paid | Tax Assessment Tax Assessment Total Assessment is a certain percentage of the fair market value that is determined by local assessors to be the total taxable value of land and additions on the property. | Land | Improvement |
|---|---|---|---|---|
| 2025 | $5,321 | $494,818 | $139,378 | $355,440 |
| 2024 | $5,321 | $485,117 | $136,646 | $348,471 |
| 2023 | $5,187 | $475,606 | $133,967 | $341,639 |
| 2022 | $5,097 | $466,282 | $131,341 | $334,941 |
| 2021 | $4,593 | $415,000 | $175,000 | $240,000 |
| 2020 | $3,998 | $360,323 | $116,575 | $243,748 |
| 2019 | $3,751 | $336,751 | $108,949 | $227,802 |
| 2018 | $3,584 | $323,800 | $104,759 | $219,041 |
| 2017 | $3,367 | $302,618 | $97,906 | $204,712 |
| 2016 | $3,032 | $280,203 | $90,654 | $189,549 |
| 2015 | $2,761 | $254,731 | $82,413 | $172,318 |
| 2014 | $2,621 | $240,312 | $77,748 | $162,564 |
Source: Public Records
Map
Nearby Homes
- 7904 Symington Way
- 7929 Symington Way
- 7920 Kelvedon Way
- 9273 Amarone Way
- 8027 Wente Way
- 9401 Rogers Rd
- 8054 Boeger Ct
- 9287 Benefield Ct
- 9042 Epernay Ct
- 9023 Colombard Way
- 9040 Durness Way
- 8950 Caselman Rd
- 8880 Sonoma Valley Way
- 9343 Boscastle Way
- 8901 Leland Ave
- 9363 Boscastle Way
- 8174 Finmere Way
- 8216 Rivallo Way
- 9028 Brittany Park Dr
- 8990 Chantal Way
- 7873 Dersingham Dr
- 7865 Dersingham Dr
- 7877 Dersingham Dr
- 7861 Dersingham Dr
- 7868 Neyland Way
- 7872 Neyland Way
- 7864 Neyland Way
- 7876 Neyland Way
- 7881 Dersingham Dr
- 7857 Dersingham Dr
- 7866 Dersingham Dr
- 7874 Dersingham Dr
- 7880 Neyland Way
- 7860 Neyland Way
- 7885 Dersingham Dr
- 7853 Dersingham Dr
- 7884 Neyland Way
- 7856 Neyland Way
- 7882 Dersingham Dr
- 7889 Dersingham Dr