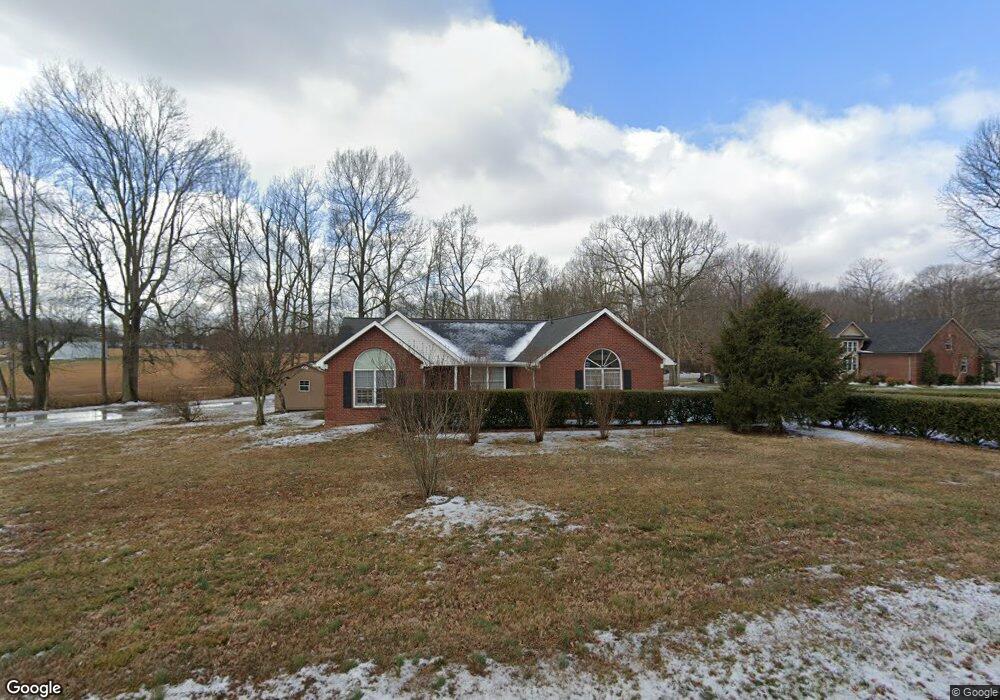
787 Mccurdy Rd White House, TN 37188
Estimated Value: $346,000 - $400,000
--
Bed
2
Baths
1,830
Sq Ft
$201/Sq Ft
Est. Value
About This Home
This home is located at 787 Mccurdy Rd, White House, TN 37188 and is currently estimated at $367,278, approximately $200 per square foot. 787 Mccurdy Rd is a home located in Sumner County with nearby schools including Harold B. Williams Elementary School, White House Middle School, and White House High School.
Ownership History
Date
Name
Owned For
Owner Type
Purchase Details
Closed on
Dec 20, 2021
Sold by
Jack Stone
Bought by
Stone David L
Current Estimated Value
Home Financials for this Owner
Home Financials are based on the most recent Mortgage that was taken out on this home.
Original Mortgage
$224,000
Outstanding Balance
$205,966
Interest Rate
3.09%
Mortgage Type
New Conventional
Estimated Equity
$161,312
Purchase Details
Closed on
Oct 29, 2004
Sold by
Zeidan Halim R and Zeidan Randa H
Bought by
Stone Jack and Stone Retha
Purchase Details
Closed on
Jul 1, 2000
Sold by
Zeidan Halim R
Bought by
Zeidan Halim R and Zeidan Randa H
Purchase Details
Closed on
Mar 25, 1999
Sold by
Sansom Johnny L and Sansom Darla A
Bought by
Zeidan Halim R
Home Financials for this Owner
Home Financials are based on the most recent Mortgage that was taken out on this home.
Original Mortgage
$139,929
Interest Rate
6.82%
Mortgage Type
FHA
Purchase Details
Closed on
Mar 3, 1997
Sold by
P & W Homes
Bought by
Sansom Johnny L and Sansom Darla A
Purchase Details
Closed on
Jun 17, 1996
Sold by
Searcy L D L and Searcy Delores J
Bought by
P & W Homes
Create a Home Valuation Report for This Property
The Home Valuation Report is an in-depth analysis detailing your home's value as well as a comparison with similar homes in the area
Home Values in the Area
Average Home Value in this Area
Purchase History
| Date | Buyer | Sale Price | Title Company |
|---|---|---|---|
| Stone David L | $270,000 | None Listed On Document | |
| Stone Jack | $160,000 | -- | |
| Zeidan Halim R | -- | -- | |
| Zeidan Halim R | $140,000 | Title Escrow Robertson Count | |
| Sansom Johnny L | $19,500 | Title Escrow Robertson Count | |
| P & W Homes | $17,500 | -- |
Source: Public Records
Mortgage History
| Date | Status | Borrower | Loan Amount |
|---|---|---|---|
| Open | Stone David L | $224,000 | |
| Previous Owner | Zeidan Halim R | $139,929 |
Source: Public Records
Tax History Compared to Growth
Tax History
| Year | Tax Paid | Tax Assessment Tax Assessment Total Assessment is a certain percentage of the fair market value that is determined by local assessors to be the total taxable value of land and additions on the property. | Land | Improvement |
|---|---|---|---|---|
| 2024 | $1,228 | $86,425 | $15,875 | $70,550 |
| 2023 | $2,049 | $57,100 | $13,525 | $43,575 |
| 2022 | $1,292 | $57,100 | $13,525 | $43,575 |
| 2021 | $2,026 | $57,100 | $13,525 | $43,575 |
| 2020 | $1,884 | $57,100 | $13,525 | $43,575 |
| 2019 | $1,884 | $0 | $0 | $0 |
| 2018 | $1,581 | $0 | $0 | $0 |
| 2017 | $1,581 | $0 | $0 | $0 |
| 2016 | $1,059 | $0 | $0 | $0 |
| 2015 | -- | $0 | $0 | $0 |
| 2014 | -- | $0 | $0 | $0 |
Source: Public Records
Map
Nearby Homes
- 109 Chalone Dr
- 101 Chalone Dr
- 427 Fieldstone Dr
- 202 Hunterwood Dr
- 200 Sapphire Dr
- 110 Sycamore Dr
- 103 Cypress Ct
- 139 Hampshire Way
- 100 Rolling Acres Dr
- 156 Hampshire Way
- 201 Hampshire Way
- 155 Telavera Dr
- 125 Sycamore Dr
- 1112 Southerlynn Dr
- 1128 Southerlynn Dr
- 1124 Southerlynn Dr
- The Caldwell Plan at Marlin Pointe
- The Phoenix Plan at Marlin Pointe
- The Pearson Plan at Marlin Pointe
- The Braselton II Plan at Marlin Pointe
- 783 Mccurdy Rd
- 784 Mccurdy Rd
- 779 Mccurdy Rd
- 775 Mccurdy Rd
- 788 Mccurdy Rd
- 771 Mccurdy Rd
- 780 Mccurdy Rd
- 774 Mccurdy Rd
- 790 Mccurdy Rd
- 770 Mccurdy Rd
- 0 2 55 Acres McCurdy Rd Unit RTC2441961
- 767 Mccurdy Rd
- 776 Mccurdy Rd
- 102 Rolling Forrest Ct
- 402 Rolling Acres Dr
- 104 Rolling Forrest Ct
- 764 Mccurdy Rd
- 106 Timberwood Ct
- 105 Timberwood Ct
- 824 Mccurdy Rd