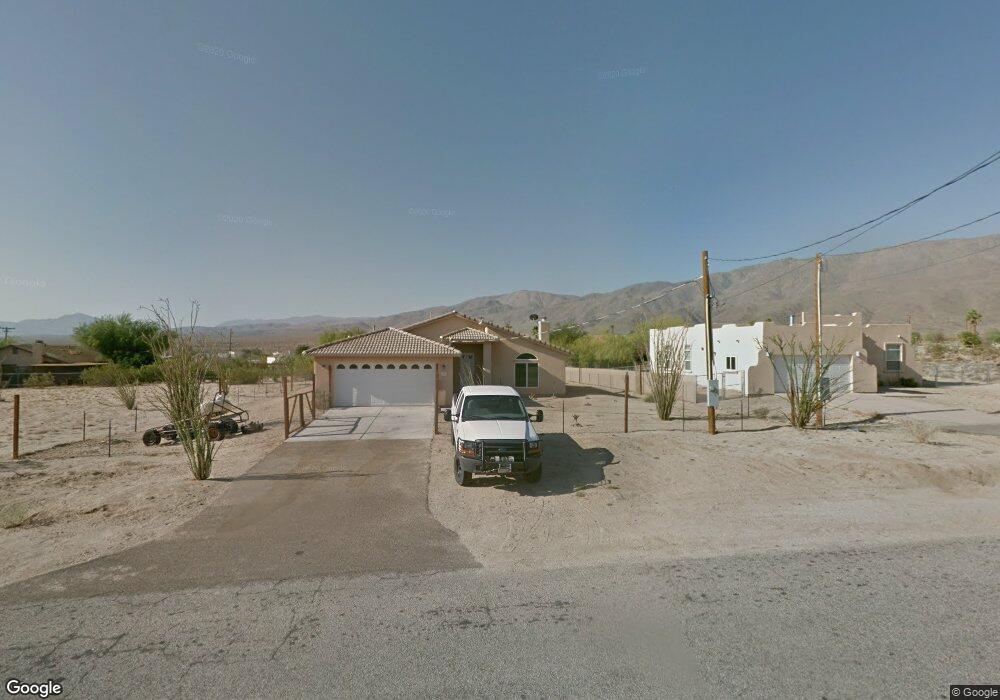
787 Rango Way Borrego Springs, CA 92004
Estimated Value: $339,049 - $465,000
3
Beds
2
Baths
1,534
Sq Ft
$253/Sq Ft
Est. Value
About This Home
This home is located at 787 Rango Way, Borrego Springs, CA 92004 and is currently estimated at $388,012, approximately $252 per square foot. 787 Rango Way is a home located in San Diego County with nearby schools including Borrego Springs Elementary School, Borrego Springs Middle School, and Borrego Springs High School.
Ownership History
Date
Name
Owned For
Owner Type
Purchase Details
Closed on
Oct 24, 2016
Sold by
Blanton Brian M and Blanton Misielle I
Bought by
Ellis Daniel and Ellis Tommi
Current Estimated Value
Home Financials for this Owner
Home Financials are based on the most recent Mortgage that was taken out on this home.
Original Mortgage
$206,196
Outstanding Balance
$165,619
Interest Rate
3.52%
Mortgage Type
FHA
Estimated Equity
$222,393
Purchase Details
Closed on
Aug 15, 2011
Sold by
Frontier Bank Fsb
Bought by
Blanton Brian M and Blanton Misielle I
Home Financials for this Owner
Home Financials are based on the most recent Mortgage that was taken out on this home.
Original Mortgage
$136,787
Interest Rate
4.26%
Mortgage Type
New Conventional
Purchase Details
Closed on
Mar 4, 2011
Sold by
Emb Cdn Partnership Lp
Bought by
Frontier Bank Fsb
Purchase Details
Closed on
Jan 4, 2005
Sold by
Melly Patrick J and Melly Geraldine
Bought by
Emb/Cdn Partnership Lp
Create a Home Valuation Report for This Property
The Home Valuation Report is an in-depth analysis detailing your home's value as well as a comparison with similar homes in the area
Home Values in the Area
Average Home Value in this Area
Purchase History
| Date | Buyer | Sale Price | Title Company |
|---|---|---|---|
| Ellis Daniel | $210,000 | Title 365 | |
| Blanton Brian M | $132,000 | First American Title | |
| Frontier Bank Fsb | -- | None Available | |
| Emb/Cdn Partnership Lp | $23,500 | Chicago Title Co |
Source: Public Records
Mortgage History
| Date | Status | Borrower | Loan Amount |
|---|---|---|---|
| Open | Ellis Daniel | $206,196 | |
| Previous Owner | Blanton Brian M | $136,787 |
Source: Public Records
Tax History Compared to Growth
Tax History
| Year | Tax Paid | Tax Assessment Tax Assessment Total Assessment is a certain percentage of the fair market value that is determined by local assessors to be the total taxable value of land and additions on the property. | Land | Improvement |
|---|---|---|---|---|
| 2025 | $2,662 | $243,717 | $69,632 | $174,085 |
| 2024 | $2,662 | $238,939 | $68,267 | $170,672 |
| 2023 | $2,607 | $234,255 | $66,929 | $167,326 |
| 2022 | $2,569 | $229,663 | $65,617 | $164,046 |
| 2021 | $2,525 | $225,161 | $64,331 | $160,830 |
| 2020 | $2,518 | $222,853 | $63,672 | $159,181 |
| 2019 | $2,343 | $218,484 | $62,424 | $156,060 |
| 2018 | $5,960 | $214,200 | $61,200 | $153,000 |
| 2017 | $5,895 | $210,000 | $60,000 | $150,000 |
| 2016 | $1,533 | $140,056 | $33,953 | $106,103 |
| 2015 | $1,512 | $137,953 | $33,443 | $104,510 |
| 2014 | $1,478 | $135,251 | $32,788 | $102,463 |
Source: Public Records
Map
Nearby Homes
- 0 Rango Way Unit NDP2506292
- 0 Rango Way Unit NDP2506231
- 0 Rango Way Unit NDP2505202
- 0 Rango Way Unit NDP2505201
- 0 Rango Way Unit NDP2505200
- 0 Rango Way Unit PW24227273
- 3314 San Rafael Rd Unit 102
- 00 Santa Saba Rd Unit 186
- 183 Santa Saba
- 864 Rango Way
- 3459 El Tejon Rd
- Lot 185 Running M Rd
- Lot 186 Running M Rd
- 3368 San Rafael Rd
- 0 Carillo Rd Unit ND25052827
- 3299 Frying Pan Rd
- 3245 Borrego Springs Rd
- 3187 Double O Rd
- 3160 Flying h Rd
- 3161 Club Cir
- 779 Rango Way
- 782 San Benito Rd
- 782 San Leon Rd
- 3524 San Rafael Rd
- 786 San Benito Rd
- 776 Rango Way
- 786 San Leon Rd
- 768 Rango Way
- 45 Rango Way
- 150 Rango Way
- 00 Rango Way
- 0 Rango Way Unit 120048010
- 0 Rango Way Unit 120048005
- 0 San Rafael Rd Unit 180035197
- 138 San Rafael
- 0130 San Rafael Rd
- 00 San Rafael
- 142 San Rafael
- 15 San Rafael
- 166 San Rafael