Estimated payment $2,954/month
Highlights
- Very Popular Property
- Above Ground Pool
- Mud Room
- Maple Grove Senior High School Rated A
- Deck
- No HOA
About This Home
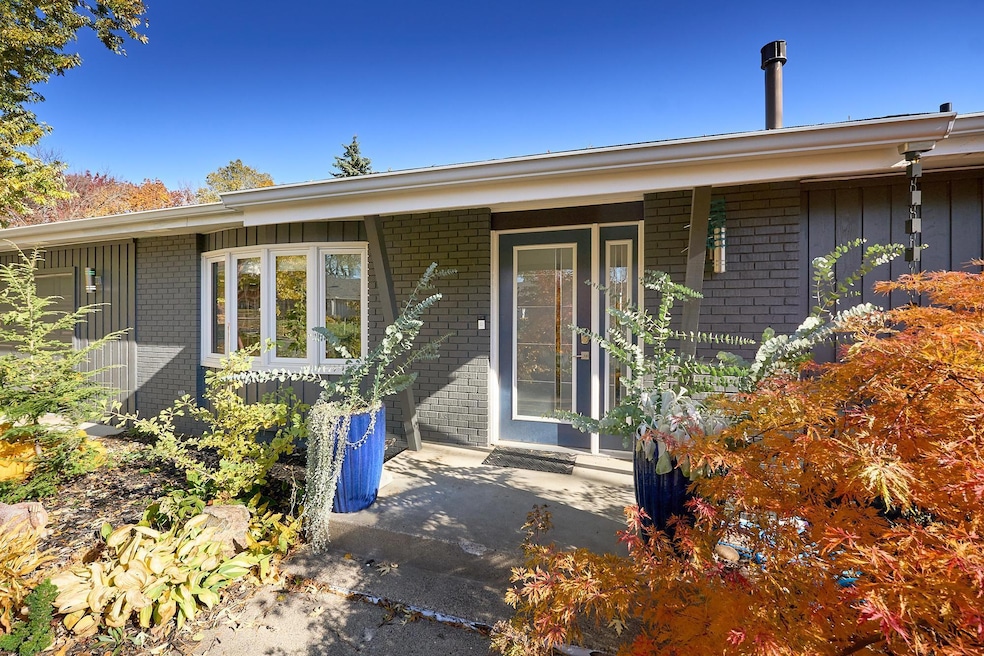
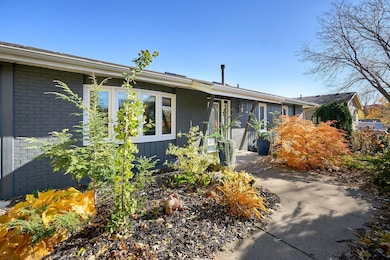
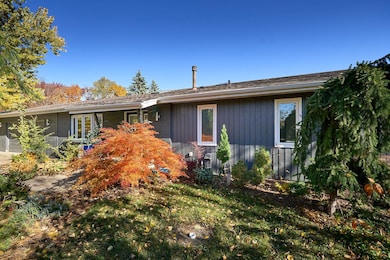
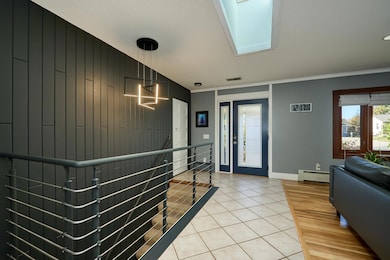
Welcome to this beautiful 5-bedroom, 3-bathroom rambler, perfectly situated in a desirable Maple Grove location. This home offers the convenience of main-level living complete with mudroom right off the garage, spacious walk-out lower level that opens directly to an above ground swimming pool creating your own private backyard oasis.The exterior boasts master gardener-designed landscaping that provides curb appeal and a serene environment. Inside, enjoy a remodeled modern kitchen featuring new appliances 2023, and peace of mind with a brand new boiler in 2025 Don't miss the opportunity to own this turn-key, move-in ready home!
Home Details
Home Type
- Single Family
Est. Annual Taxes
- $5,164
Year Built
- Built in 1983
Lot Details
- 0.26 Acre Lot
- Lot Dimensions are 88x130
- Chain Link Fence
- Many Trees
Parking
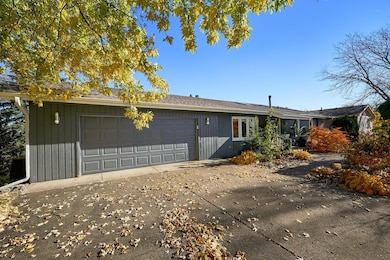
- 2 Car Attached Garage
Home Design
- Wood Siding
Interior Spaces
- 1-Story Property
- Mud Room
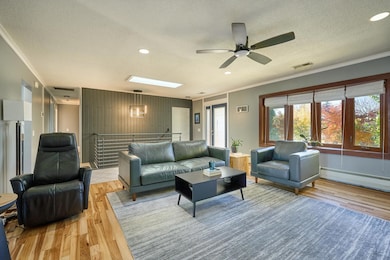
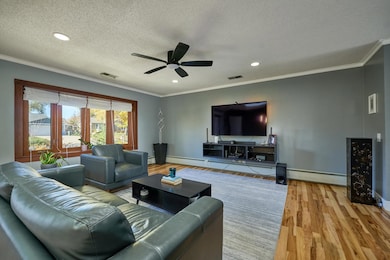
- Family Room with Fireplace
- Living Room
- Dining Room
- Workshop
Kitchen
- Cooktop
- Microwave
- Dishwasher
- Stainless Steel Appliances
- Disposal
- The kitchen features windows
Bedrooms and Bathrooms
- 5 Bedrooms
Laundry
- Dryer
- Washer
Finished Basement
- Walk-Out Basement
- Basement Fills Entire Space Under The House
- Basement Storage
Outdoor Features
- Above Ground Pool
- Deck
Utilities
- Central Air
- Baseboard Heating
- Hot Water Heating System
Community Details
- No Home Owners Association
- Shorecrest 2Nd Add Subdivision
Listing and Financial Details
- Assessor Parcel Number 2111922340086
Map
Home Values in the Area
Average Home Value in this Area
Tax History
| Year | Tax Paid | Tax Assessment Tax Assessment Total Assessment is a certain percentage of the fair market value that is determined by local assessors to be the total taxable value of land and additions on the property. | Land | Improvement |
|---|---|---|---|---|
| 2024 | $5,164 | $430,900 | $121,000 | $309,900 |
| 2023 | $5,227 | $445,700 | $129,700 | $316,000 |
| 2022 | $4,354 | $429,700 | $101,500 | $328,200 |
| 2021 | $4,167 | $362,500 | $83,000 | $279,500 |
| 2020 | $4,164 | $342,800 | $72,400 | $270,400 |
| 2019 | $4,191 | $326,600 | $67,000 | $259,600 |
| 2018 | $4,235 | $311,700 | $58,000 | $253,700 |
| 2017 | $3,994 | $282,300 | $68,000 | $214,300 |
| 2016 | $3,950 | $276,000 | $68,000 | $208,000 |
| 2015 | $3,858 | $263,500 | $63,000 | $200,500 |
| 2014 | -- | $240,400 | $53,000 | $187,400 |
Purchase History
| Date | Type | Sale Price | Title Company |
|---|---|---|---|
| Interfamily Deed Transfer | -- | None Available | |
| Warranty Deed | $280,000 | All American Ttle Co Inc |
Mortgage History
| Date | Status | Loan Amount | Loan Type |
|---|---|---|---|
| Open | $266,000 | New Conventional |
Source: NorthstarMLS
MLS Number: 6785731
APN: 21-119-22-34-0086
Disclaimer: Certain information contained herein is derived from information provided by parties other than Homes.com. All information provided is deemed reliable, but is not guaranteed to be accurate and should be independently verified.
![]() Based on information submitted to the MLS GRID. All data is obtained from various sources and may not have been verified by broker or MLS GRID. Supplied Open House Information is subject to change without notice. All information should be independently reviewed and verified for accuracy. Properties may or may not be listed by the office/agent presenting the information. Some IDX listings have been excluded from this website.
Based on information submitted to the MLS GRID. All data is obtained from various sources and may not have been verified by broker or MLS GRID. Supplied Open House Information is subject to change without notice. All information should be independently reviewed and verified for accuracy. Properties may or may not be listed by the office/agent presenting the information. Some IDX listings have been excluded from this website.
The Digital Millennium Copyright Act of 1998, 17 U.S.C. § 512 (the “DMCA”) provides recourse for copyright owners who believe that material appearing on the Internet infringes their rights under U.S. copyright law. If you believe in good faith that any content or material made available in connection with our website or services infringes your copyright, you (or your agent) may send us a notice requesting that the content or material be removed, or access to it blocked.
Notices must be sent in writing by email to DMCAnotice@MLSGrid.com.
The DMCA requires that your notice of alleged copyright infringement include the following information:
(1) description of the copyrighted work that is the subject of claimed infringement;
(2) description of the alleged infringing content and information sufficient to permit us to locate the content;
(3) contact information for you, including your address, telephone number and email address;
(4) a statement by you that you have a good faith belief that the content in the manner complained of is not authorized by the copyright owner, or its agent, or by the operation of any law;
(5) a statement by you, signed under penalty of perjury, that the information in the notification is accurate and that you have the authority to enforce the copyrights that are claimed to be infringed; and
(6) a physical or electronic signature of the copyright owner or a person authorized to act on the copyright owner’s behalf. Failure to include all of the above information may result in the delay of the processing of your complaint.
- 7720 Niagara Ln N
- 7783 Kingsview Ln N
- 7580 Orchid Ln N
- 15201 82nd Ave N
- 7585 Lanewood Ln N
- 14714 80th Ave N
- 7460 Shenandoah Ln N
- 7453 Mariner Dr
- 15770 73rd Place N
- 15653 73rd Cir N
- 7244 Quantico Ln N
- 7247 Quantico Ln N
- 7585 Blackoaks Ln N
- 8347 Zanzibar Ct N
- 7788 Everest Ct N
- 14067 81st Ave N
- 16824 79th Ave N
- 8566 Quarles Rd
- 14023 81st Ave N
- 7722 Everest Ln N
- 7492 Dallas Ln N
- 7081 Quantico Ln N
- 16168 70th Place N
- 13301 Maple Knoll Way
- 6876 Vicksburg Ln N
- 12911 Arbor Lakes Pkwy N
- 9351 Polaris Ln N
- 16600 92nd Ave N
- 12598 84th Place N
- 6819 Narcissus Ln N
- 8903 Olive Ln N
- 9325 Garland Ave
- 9486 Kingsview Ln N
- 6515 Merrimac Ln N
- 17697 65th Place N
- 11851 Central Park Way
- 7225 Hemlock Ln
- 11650 Arbor Lakes Pkwy N
- 18928 73rd Ave N
- 15726 60th Ave N
