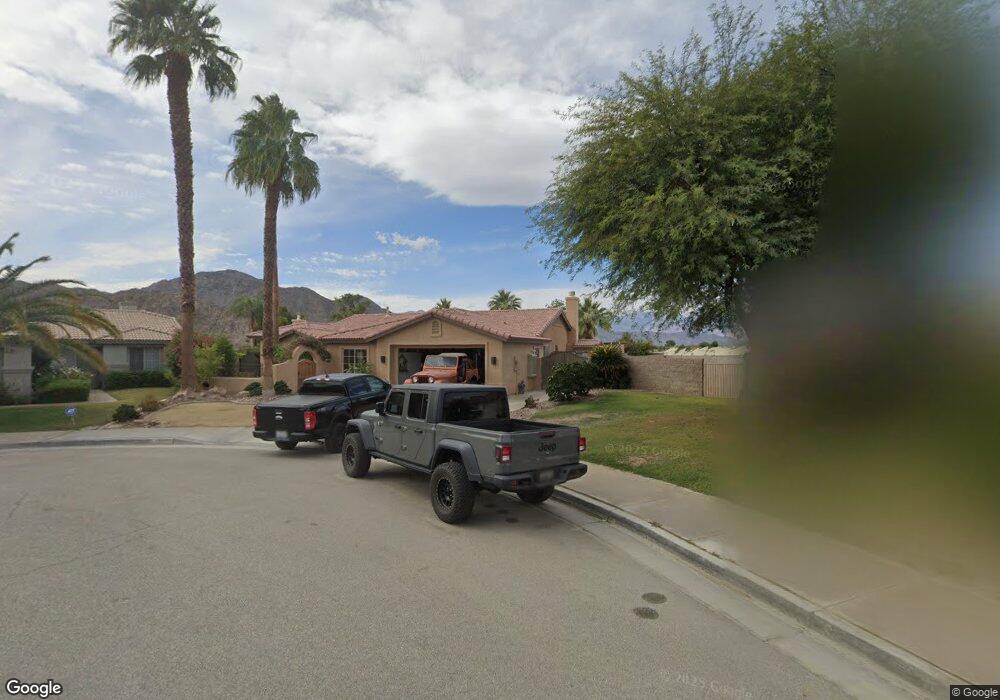
78710 Rockberry Ct La Quinta, CA 92253
Estimated Value: $601,000 - $732,000
5
Beds
2
Baths
2,691
Sq Ft
$254/Sq Ft
Est. Value
About This Home
This home is located at 78710 Rockberry Ct, La Quinta, CA 92253 and is currently estimated at $683,159, approximately $253 per square foot. 78710 Rockberry Ct is a home located in Riverside County with nearby schools including Amelia Earhart Elementary School Of International Studies, John Glenn Middle School Of International Studies, and La Quinta High School.
Ownership History
Date
Name
Owned For
Owner Type
Purchase Details
Closed on
Aug 14, 2009
Sold by
Boydstun Gary P and Boydstun Jan C
Bought by
Boydstun Gary and Boydstun Jan C
Current Estimated Value
Home Financials for this Owner
Home Financials are based on the most recent Mortgage that was taken out on this home.
Original Mortgage
$300,000
Outstanding Balance
$196,498
Interest Rate
5.3%
Mortgage Type
New Conventional
Estimated Equity
$486,661
Purchase Details
Closed on
Mar 20, 2009
Sold by
Boydstun Gary and Boydstun Jan C
Bought by
Boydstun Gary P and Boydstun Jan C
Purchase Details
Closed on
Sep 5, 2000
Sold by
Siena Del Rey Llc
Bought by
Boydstun Gary and Boydstun Jan C
Home Financials for this Owner
Home Financials are based on the most recent Mortgage that was taken out on this home.
Original Mortgage
$100,000
Interest Rate
7.98%
Create a Home Valuation Report for This Property
The Home Valuation Report is an in-depth analysis detailing your home's value as well as a comparison with similar homes in the area
Home Values in the Area
Average Home Value in this Area
Purchase History
| Date | Buyer | Sale Price | Title Company |
|---|---|---|---|
| Boydstun Gary | -- | Lawyers Title Company | |
| Boydstun Gary P | -- | None Available | |
| Boydstun Gary | $196,500 | First American Title Co |
Source: Public Records
Mortgage History
| Date | Status | Borrower | Loan Amount |
|---|---|---|---|
| Open | Boydstun Gary | $300,000 | |
| Closed | Boydstun Gary | $100,000 |
Source: Public Records
Tax History Compared to Growth
Tax History
| Year | Tax Paid | Tax Assessment Tax Assessment Total Assessment is a certain percentage of the fair market value that is determined by local assessors to be the total taxable value of land and additions on the property. | Land | Improvement |
|---|---|---|---|---|
| 2025 | $4,901 | $352,466 | $60,257 | $292,209 |
| 2023 | $4,901 | $338,781 | $57,918 | $280,863 |
| 2022 | $4,596 | $332,139 | $56,783 | $275,356 |
| 2021 | $9,969 | $325,627 | $55,670 | $269,957 |
| 2020 | $9,888 | $322,289 | $55,100 | $267,189 |
| 2019 | $9,799 | $315,970 | $54,020 | $261,950 |
| 2018 | $10,298 | $309,775 | $52,962 | $256,813 |
| 2017 | $10,229 | $303,702 | $51,924 | $251,778 |
| 2016 | $10,144 | $297,748 | $50,906 | $246,842 |
| 2015 | $10,145 | $293,278 | $50,143 | $243,135 |
| 2014 | $4,615 | $287,534 | $49,161 | $238,373 |
Source: Public Records
Map
Nearby Homes
- 45245 Seeley Dr Unit 15G
- 45245 Seeley Dr Unit 17A
- 78640 Alden Cir
- 78670 Bradford Cir
- 44865 Via Alondra
- 44830 Via Mirabel
- 46614 Bradshaw Trail
- 79030 Ladera Dr
- 78440 Via Palomino
- 79300 Desert Stream Dr
- 78310 Crestview Terrace
- 79305 Desert Wind Ct
- 79385 Avenida Las Palmas
- 46560 Arapahoe Unit A
- 78755 Villeta Dr
- 78347 Scarlet Ct
- 46552 Arapahoe
- 79389 Paseo Del Rey
- 44520 Via Terra Nova
- 79185 Canterra Cir
- 78705 Rockberry Ct
- 78720 Rockberry Ct
- 78715 Rockberry Ct
- 78730 Rockberry Ct
- 78725 Rockberry Ct
- 78735 Rockberry Ct
- 78740 Rockberry Ct
- 78735 Wakefield Cir
- 78745 Rockberry Ct
- 78725 Wakefield Cir
- 78750 Rockberry Ct
- 78715 Wakefield Cir
- 78755 Rockberry Ct
- 78705 Wakefield Cir
- 45415 Coldbrook Ln
- 78740 Wakefield Cir
- 45395 Coldbrook Ln
- 45,505 Coldbrook Ln
- 45505 Coldbrook Ln
- 78765 Wakefield Cir