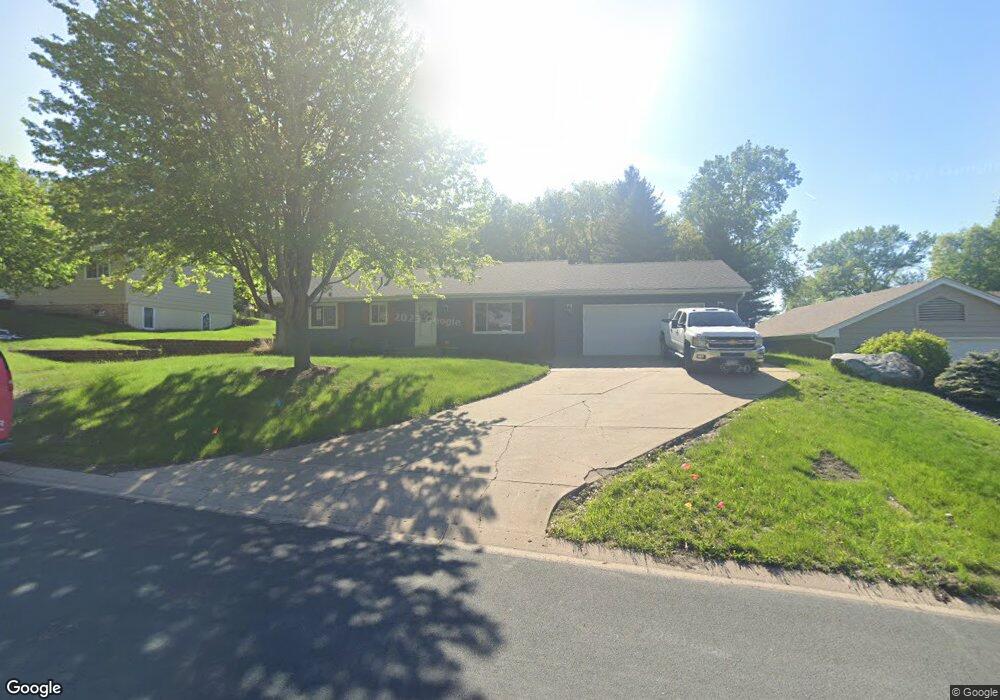
7879 Conroy Way Inver Grove Heights, MN 55076
Estimated Value: $384,977 - $451,000
4
Beds
2
Baths
1,144
Sq Ft
$366/Sq Ft
Est. Value
About This Home
This home is located at 7879 Conroy Way, Inver Grove Heights, MN 55076 and is currently estimated at $418,494, approximately $365 per square foot. 7879 Conroy Way is a home located in Dakota County with nearby schools including Hilltop Elementary School, Inver Grove Heights Middle School, and Simley Senior High School.
Ownership History
Date
Name
Owned For
Owner Type
Purchase Details
Closed on
Aug 23, 2017
Sold by
Fox Blake R and Fox Danielle Amber
Bought by
Truesdell Troy A and Truesdell Ashley A
Current Estimated Value
Home Financials for this Owner
Home Financials are based on the most recent Mortgage that was taken out on this home.
Original Mortgage
$264,601
Outstanding Balance
$220,431
Interest Rate
3.9%
Mortgage Type
VA
Estimated Equity
$198,063
Purchase Details
Closed on
Jun 27, 2008
Sold by
Hoey Thomas J and Hoey Sharon H
Bought by
Fox Blake R and Kost Danielle A
Home Financials for this Owner
Home Financials are based on the most recent Mortgage that was taken out on this home.
Original Mortgage
$219,951
Interest Rate
6.12%
Mortgage Type
FHA
Purchase Details
Closed on
Jan 23, 2003
Sold by
Sweeney Maurice N and Schneider Darrel C
Bought by
Hoey Thomas J and Hoey Sharon H
Create a Home Valuation Report for This Property
The Home Valuation Report is an in-depth analysis detailing your home's value as well as a comparison with similar homes in the area
Home Values in the Area
Average Home Value in this Area
Purchase History
| Date | Buyer | Sale Price | Title Company |
|---|---|---|---|
| Truesdell Troy A | $258,400 | Edina Realty Title Inc | |
| Fox Blake R | $223,404 | -- | |
| Hoey Thomas J | $219,900 | -- |
Source: Public Records
Mortgage History
| Date | Status | Borrower | Loan Amount |
|---|---|---|---|
| Open | Truesdell Troy A | $264,601 | |
| Previous Owner | Fox Blake R | $219,951 |
Source: Public Records
Tax History Compared to Growth
Tax History
| Year | Tax Paid | Tax Assessment Tax Assessment Total Assessment is a certain percentage of the fair market value that is determined by local assessors to be the total taxable value of land and additions on the property. | Land | Improvement |
|---|---|---|---|---|
| 2024 | $3,196 | $333,700 | $80,400 | $253,300 |
| 2023 | $3,196 | $317,000 | $78,400 | $238,600 |
| 2022 | $2,998 | $318,500 | $78,300 | $240,200 |
| 2021 | $2,978 | $279,700 | $68,100 | $211,600 |
| 2020 | $2,822 | $273,500 | $64,800 | $208,700 |
| 2019 | $2,898 | $259,900 | $61,700 | $198,200 |
| 2018 | $2,637 | $249,600 | $58,800 | $190,800 |
| 2017 | $3,375 | $228,000 | $56,000 | $172,000 |
| 2016 | $3,311 | $205,600 | $53,400 | $152,200 |
| 2015 | $3,403 | $178,798 | $47,000 | $131,798 |
| 2014 | -- | $164,410 | $44,524 | $119,886 |
| 2013 | -- | $154,382 | $41,098 | $113,284 |
Source: Public Records
Map
Nearby Homes
- 3617 76th Ln E
- 3901 Conroy Trail
- 7996 Corey Path
- 3907 Conroy Trail
- 7614 Connie Ln
- 3861 Conroy Trail
- 7944 Charles Way
- 3650 75th St E
- 7447 Cloman Way
- 8086 Dana Path
- 4049 75th St E
- 7393 Clayton Ave
- 8336 Cloman Ave
- 8124 Clifford Cir
- 8404 Copperfield Way Unit 101
- 8406 Copperfield Way Unit 102
- 8381 Corcoran Cir Unit 49
- 7344 Degrio Way
- 3085 Upper 76th St E
- 6931 Crosby Ave
- 7853 Conroy Way
- 7885 Conroy Way
- 7835 Conroy Way
- 7897 Conroy Way
- 7880 Conroy Way
- 7868 Conroy Way
- 7844 Conroy Way
- 7892 Conroy Way
- 7827 Conroy Way
- 7907 Conroy Way
- 7830 Conroy Way
- 7900 Conroy Way
- 7915 Conroy Way
- 3720 78th St E
- 7849 Cooper Ave
- 7869 Cooper Ave
- 7904 Conroy Way
- 7927 Conroy Way
- 7877 Cooper Ave
- 7827 Cooper Ave