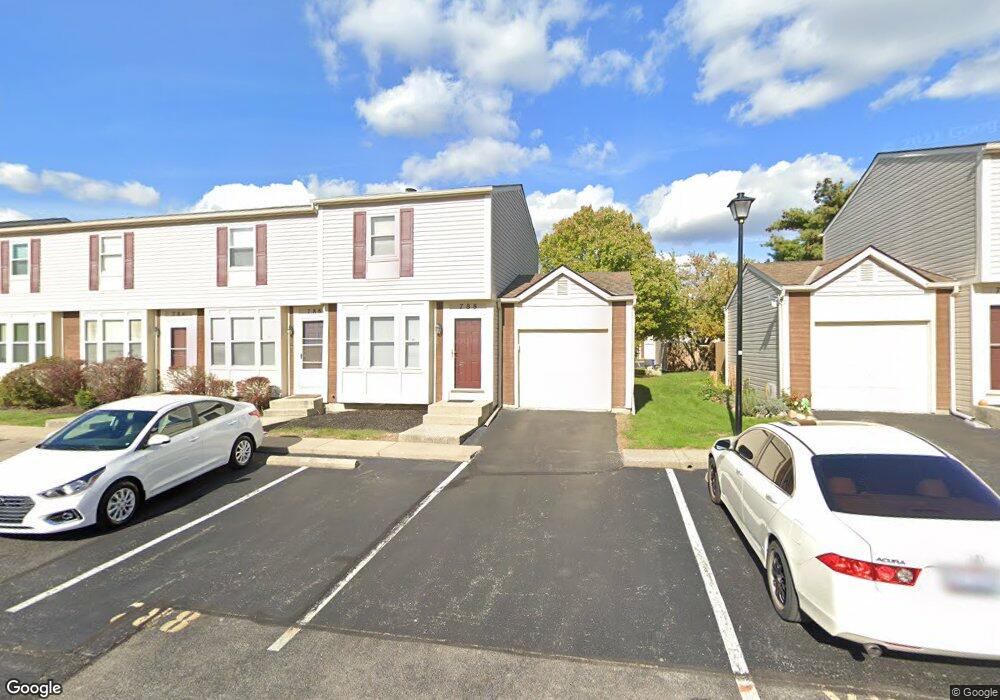
788 Cap Ln Unit 19E Worthington, OH 43085
Slate Hill NeighborhoodEstimated Value: $199,000 - $217,000
2
Beds
2
Baths
848
Sq Ft
$249/Sq Ft
Est. Value
About This Home
This home is located at 788 Cap Ln Unit 19E, Worthington, OH 43085 and is currently estimated at $211,220, approximately $249 per square foot. 788 Cap Ln Unit 19E is a home located in Franklin County with nearby schools including Worthington Estates Elementary School, Worthingway Middle School, and Thomas Worthington High School.
Ownership History
Date
Name
Owned For
Owner Type
Purchase Details
Closed on
Oct 13, 2020
Sold by
Theiss Elizabeth C
Bought by
Rigney Nicholas A
Current Estimated Value
Home Financials for this Owner
Home Financials are based on the most recent Mortgage that was taken out on this home.
Original Mortgage
$144,045
Outstanding Balance
$127,887
Interest Rate
2.8%
Mortgage Type
New Conventional
Estimated Equity
$83,333
Purchase Details
Closed on
Jun 25, 1998
Sold by
Tillman Raymond and Williams Billie
Bought by
Theiss Elizabeth C
Purchase Details
Closed on
Jun 14, 1995
Sold by
Burkhart Frank L
Bought by
Williams Raymond and Williams Billie
Purchase Details
Closed on
Oct 14, 1994
Sold by
Brown Delia and Brown May
Bought by
Burkhart Frank L and Burkhart Patricia
Create a Home Valuation Report for This Property
The Home Valuation Report is an in-depth analysis detailing your home's value as well as a comparison with similar homes in the area
Home Values in the Area
Average Home Value in this Area
Purchase History
| Date | Buyer | Sale Price | Title Company |
|---|---|---|---|
| Rigney Nicholas A | $148,500 | Crown Search Services Ltd | |
| Theiss Elizabeth C | $62,200 | Preferred Title Agency Inc | |
| Williams Raymond | $58,397 | -- | |
| Burkhart Frank L | $56,900 | -- |
Source: Public Records
Mortgage History
| Date | Status | Borrower | Loan Amount |
|---|---|---|---|
| Open | Rigney Nicholas A | $144,045 |
Source: Public Records
Tax History Compared to Growth
Tax History
| Year | Tax Paid | Tax Assessment Tax Assessment Total Assessment is a certain percentage of the fair market value that is determined by local assessors to be the total taxable value of land and additions on the property. | Land | Improvement |
|---|---|---|---|---|
| 2024 | $3,905 | $63,600 | $14,350 | $49,250 |
| 2023 | $3,734 | $63,595 | $14,350 | $49,245 |
| 2022 | $3,416 | $46,170 | $4,410 | $41,760 |
| 2021 | $3,152 | $46,170 | $4,410 | $41,760 |
| 2020 | $2,518 | $38,290 | $4,410 | $33,880 |
| 2019 | $2,327 | $31,930 | $3,680 | $28,250 |
| 2018 | $2,009 | $31,930 | $3,680 | $28,250 |
| 2017 | $2,085 | $31,930 | $3,680 | $28,250 |
| 2016 | $1,764 | $24,850 | $4,270 | $20,580 |
| 2015 | $1,765 | $24,850 | $4,270 | $20,580 |
| 2014 | $1,764 | $24,850 | $4,270 | $20,580 |
| 2013 | $974 | $27,580 | $4,725 | $22,855 |
Source: Public Records
Map
Nearby Homes
- 796 Timber Way Dr Unit 15B
- 7697 Barkwood Dr Unit 1D
- 737 Plant Dr Unit 2-C
- 716 Alta View Ct Unit 33
- 696 Keys View Ct Unit 77
- 7634 Kelvinway Dr Unit 150
- 910 Annagladys Dr Unit G2
- 7415 Cayman Ln Unit 7415
- 7685 Whitneyway Dr Unit 17
- 580 Mawyer Dr Unit 132
- 7416 Sancus Blvd
- 7850 Malton Ln Unit 14E
- 874 Charnwood Ln Unit 5D
- 1090 Landings Loop Unit 36
- 7981 Oakwind Ct
- 1158 Worthington Woods Blvd
- 889 Pelham Ct
- 1212 Tillicum Dr
- 7916 Sudeley Ct
- 1291 Worthington Creek Dr Unit 7
- 786 Cap Ln
- 786 Cap Ln Unit 19-D
- 784 Cap Ln Unit 19C
- 792 Cap Ln
- 782 Cap Ln Unit 19B
- 794 Cap Ln
- 780 Cap Ln Unit 19A
- 798 Cap Ln Unit 21D
- 785 Ficus Dr Unit 25A
- 783 Ficus Dr Unit 25B
- 781 Ficus Dr Unit 25C
- 785 Cap Ln Unit 20B
- 779 Ficus Dr Unit 25D
- 791 Ficus Dr Unit 27E
- 787 Cap Ln Unit 20A
- 781 Cap Ln Unit 20D
- 793 Ficus Dr Unit 27D
- 791 Cap Ln
- 783 Cap Ln Unit 20C
- 800 Cap Ln Unit 21E