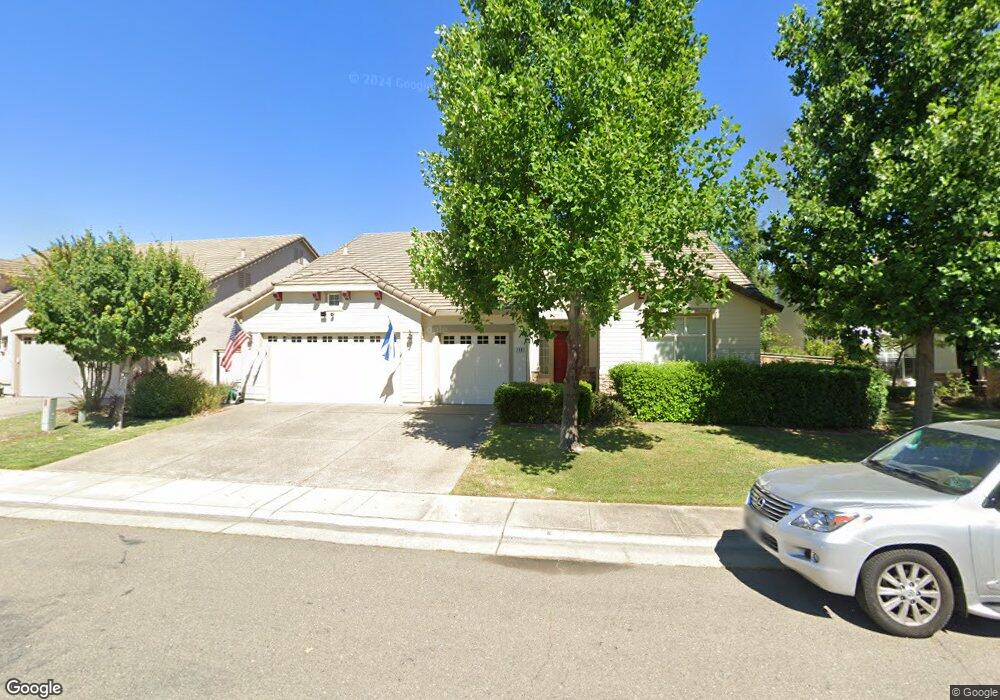
788 Duncan Way Folsom, CA 95630
Prairie Oaks NeighborhoodEstimated Value: $697,000 - $901,000
4
Beds
3
Baths
2,497
Sq Ft
$324/Sq Ft
Est. Value
About This Home
This home is located at 788 Duncan Way, Folsom, CA 95630 and is currently estimated at $809,199, approximately $324 per square foot. 788 Duncan Way is a home located in Sacramento County with nearby schools including Sandra J. Gallardo Elementary School, Sutter Middle School, and Folsom High School.
Ownership History
Date
Name
Owned For
Owner Type
Purchase Details
Closed on
Mar 8, 2011
Sold by
May Calvin A and May Nan C
Bought by
May Calvin Arthur and May Nan Craig
Current Estimated Value
Purchase Details
Closed on
Jul 6, 2000
Sold by
Lennar Renaissance Inc
Bought by
May Calvin A and May Nan C
Home Financials for this Owner
Home Financials are based on the most recent Mortgage that was taken out on this home.
Original Mortgage
$276,100
Outstanding Balance
$103,267
Interest Rate
8.87%
Estimated Equity
$705,932
Create a Home Valuation Report for This Property
The Home Valuation Report is an in-depth analysis detailing your home's value as well as a comparison with similar homes in the area
Home Values in the Area
Average Home Value in this Area
Purchase History
| Date | Buyer | Sale Price | Title Company |
|---|---|---|---|
| May Calvin Arthur | -- | None Available | |
| May Calvin A | $291,000 | North American Title Guarant |
Source: Public Records
Mortgage History
| Date | Status | Borrower | Loan Amount |
|---|---|---|---|
| Open | May Calvin A | $276,100 |
Source: Public Records
Tax History
| Year | Tax Paid | Tax Assessment Tax Assessment Total Assessment is a certain percentage of the fair market value that is determined by local assessors to be the total taxable value of land and additions on the property. | Land | Improvement |
|---|---|---|---|---|
| 2025 | $5,441 | $464,362 | $105,465 | $358,897 |
| 2024 | $5,441 | $455,258 | $103,398 | $351,860 |
| 2023 | $5,343 | $446,332 | $101,371 | $344,961 |
| 2022 | $5,252 | $437,582 | $99,384 | $338,198 |
| 2021 | $5,188 | $429,003 | $97,436 | $331,567 |
| 2020 | $4,816 | $424,605 | $96,437 | $328,168 |
| 2019 | $4,738 | $416,281 | $94,547 | $321,734 |
| 2018 | $4,624 | $408,120 | $92,694 | $315,426 |
| 2017 | $6,173 | $400,119 | $90,877 | $309,242 |
| 2016 | $6,371 | $392,275 | $89,096 | $303,179 |
| 2015 | $6,154 | $386,383 | $87,758 | $298,625 |
| 2014 | $5,909 | $378,815 | $86,039 | $292,776 |
Source: Public Records
Map
Nearby Homes
- 631 Rogers Cir
- 157 Sutcliffe Cir
- 692 Humbert St
- 0 Figueroa St Unit 225034113
- 701 Ferrier Way
- 102 Black Gold Ln
- 145 Hopfield Dr
- 275 Barnhill Dr
- 894 Blossom Rock Ln
- 682 Diamond Glen Cir
- 931 Willow Bridge Dr
- 448 Gem Smith Place
- 469 Facet Place
- 120 Conductor Way
- 656 Silo St
- 301 Blossom Rock Ln Unit 53
- 122 Kennar Way
- 503 Diamond Glen Cir
- 110 Lembi Dr
- 510 Diamond Glen Cir
Your Personal Tour Guide
Ask me questions while you tour the home.