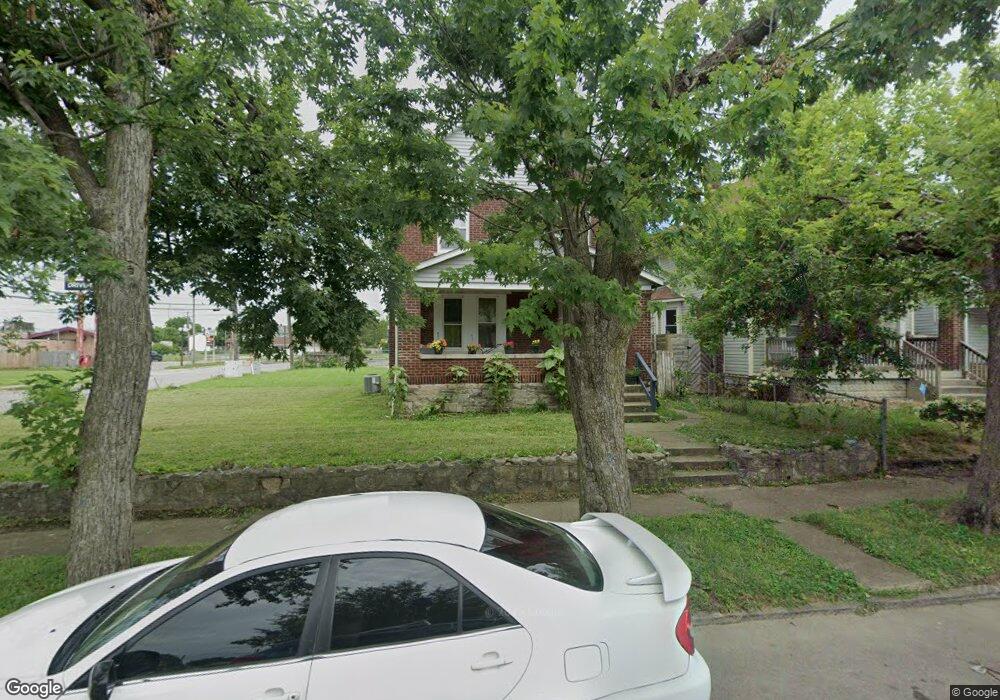
788 E 4th Ave Columbus, OH 43201
Milo-Grogan NeighborhoodEstimated Value: $169,000 - $239,000
4
Beds
1
Bath
1,572
Sq Ft
$128/Sq Ft
Est. Value
About This Home
This home is located at 788 E 4th Ave, Columbus, OH 43201 and is currently estimated at $201,147, approximately $127 per square foot. 788 E 4th Ave is a home located in Franklin County with nearby schools including Windsor Stem Acadmey, Linden-Mckinley Stem School On Arcadia, and Columbus Performance Academy.
Ownership History
Date
Name
Owned For
Owner Type
Purchase Details
Closed on
Oct 6, 2010
Sold by
Inyamah Jonathan
Bought by
Uptown Homes Inc
Current Estimated Value
Purchase Details
Closed on
Mar 25, 2008
Sold by
Lasalle Bank Na
Bought by
Inyamah Jonathan
Purchase Details
Closed on
Oct 23, 2007
Sold by
Smith Elton and Case #06Cve11 15378
Bought by
Lasalle Bank Na and Bear Stearns Asset Backed Securities I L
Purchase Details
Closed on
Aug 24, 2004
Sold by
Smith Martha L
Bought by
Smith Elton
Home Financials for this Owner
Home Financials are based on the most recent Mortgage that was taken out on this home.
Original Mortgage
$71,100
Interest Rate
7.95%
Mortgage Type
New Conventional
Purchase Details
Closed on
Mar 19, 1998
Sold by
Haslett Stacy L and Fraternal Brothers The Aoa Col
Bought by
Smith Martha L and Smith Elton
Purchase Details
Closed on
Feb 28, 1994
Bought by
Fraternal Brothers Of The
Create a Home Valuation Report for This Property
The Home Valuation Report is an in-depth analysis detailing your home's value as well as a comparison with similar homes in the area
Home Values in the Area
Average Home Value in this Area
Purchase History
| Date | Buyer | Sale Price | Title Company |
|---|---|---|---|
| Uptown Homes Inc | -- | None Available | |
| Inyamah Jonathan | $12,000 | None Available | |
| Lasalle Bank Na | $48,000 | None Available | |
| Smith Elton | -- | Land Sel Ti | |
| Smith Martha L | $19,600 | -- | |
| Fraternal Brothers Of The | $9,000 | -- |
Source: Public Records
Mortgage History
| Date | Status | Borrower | Loan Amount |
|---|---|---|---|
| Previous Owner | Smith Elton | $71,100 |
Source: Public Records
Tax History Compared to Growth
Tax History
| Year | Tax Paid | Tax Assessment Tax Assessment Total Assessment is a certain percentage of the fair market value that is determined by local assessors to be the total taxable value of land and additions on the property. | Land | Improvement |
|---|---|---|---|---|
| 2024 | $2,332 | $50,890 | $5,250 | $45,640 |
| 2023 | $2,303 | $50,890 | $5,250 | $45,640 |
| 2022 | $1,258 | $23,670 | $2,210 | $21,460 |
| 2021 | $1,455 | $23,670 | $2,210 | $21,460 |
| 2020 | $1,262 | $23,670 | $2,210 | $21,460 |
| 2019 | $1,298 | $20,870 | $1,930 | $18,940 |
| 2018 | $648 | $20,870 | $1,930 | $18,940 |
| 2017 | $1,297 | $20,870 | $1,930 | $18,940 |
| 2016 | $1,044 | $15,370 | $1,610 | $13,760 |
| 2015 | $475 | $15,370 | $1,610 | $13,760 |
| 2014 | $953 | $15,370 | $1,610 | $13,760 |
| 2013 | -- | $17,080 | $1,785 | $15,295 |
Source: Public Records
Map
Nearby Homes
- 796 E 4th Ave
- 1025 Howard St
- 780-782 Gibbard Ave
- 997-999 Gibbard Ave
- 879 E 4th Ave
- 773-775 E 3rd Ave
- 650 E 3rd Ave
- 1112 Peters Ave
- 276 E 4th Ave
- 841 Saint Clair Ave
- 663 E 2nd Ave
- 911 Camden Ave
- 923 Camden Ave
- 927 Camden Ave
- 472 Reynolds Ave Unit 474
- 0 Leona Ave
- 1222 N Grant Ave Unit H
- 661 E 11th Ave
- 1233 Cromartie Ln
- 1250 N Grant Ave
- 800 E 4th Ave
- 800 N 4th St Unit B
- 0 E Fourth Ave
- 808 E 4th Ave
- 808 N 4th St Unit 12/D2
- 812 E 4th Ave
- 1027 Howard St Unit 29
- 1027 Howard St Unit 2
- 1015 Howard St
- 789 E 4th Ave
- 793 E 4th Ave
- 777 E 5th Ave
- 797 E 4th Ave Unit 799
- 816 E 4th Ave
- 816 N 4th St Unit D
- 801 E 4th Ave
- 1001 Howard St
- 805 E 4th Ave Unit 807
- 0 E Fourth Ave
- 997 Howard St