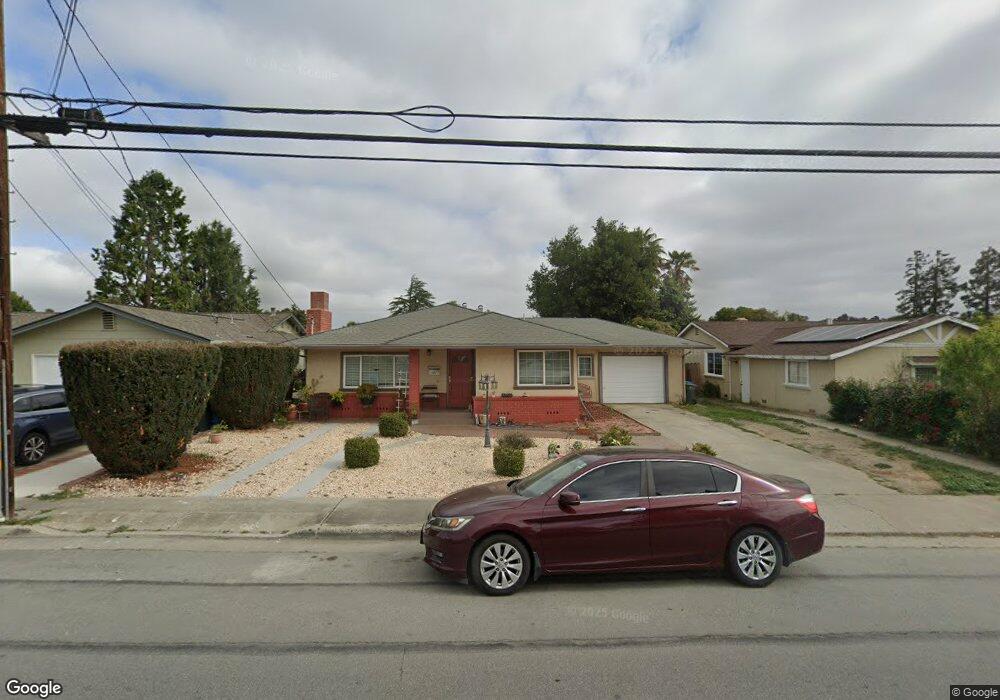
788 South St Hollister, CA 95023
Estimated Value: $553,000 - $686,000
--
Bed
--
Bath
--
Sq Ft
8,625
Sq Ft Lot
About This Home
This home is located at 788 South St, Hollister, CA 95023 and is currently estimated at $618,848. 788 South St is a home located in San Benito County with nearby schools including R. O. Hardin Elementary School, Rancho San Justo School, and San Benito High School.
Ownership History
Date
Name
Owned For
Owner Type
Purchase Details
Closed on
Dec 27, 1999
Sold by
Contival Pierre J and Larios Cheryl M
Bought by
Salazar Francisco and Villanueva Irma
Current Estimated Value
Home Financials for this Owner
Home Financials are based on the most recent Mortgage that was taken out on this home.
Original Mortgage
$194,400
Outstanding Balance
$60,030
Interest Rate
7.68%
Estimated Equity
$558,818
Purchase Details
Closed on
Jul 20, 1999
Sold by
Banks E Josephine Trust and Pierre J
Bought by
Contival Pierre J and Larios Cheryl M
Create a Home Valuation Report for This Property
The Home Valuation Report is an in-depth analysis detailing your home's value as well as a comparison with similar homes in the area
Home Values in the Area
Average Home Value in this Area
Purchase History
| Date | Buyer | Sale Price | Title Company |
|---|---|---|---|
| Salazar Francisco | $216,000 | San Benito Land Title Corp | |
| Contival Pierre J | -- | -- |
Source: Public Records
Mortgage History
| Date | Status | Borrower | Loan Amount |
|---|---|---|---|
| Open | Salazar Francisco | $194,400 |
Source: Public Records
Tax History Compared to Growth
Tax History
| Year | Tax Paid | Tax Assessment Tax Assessment Total Assessment is a certain percentage of the fair market value that is determined by local assessors to be the total taxable value of land and additions on the property. | Land | Improvement |
|---|---|---|---|---|
| 2025 | $4,601 | $385,105 | $153,691 | $231,414 |
| 2023 | $4,601 | $370,153 | $147,724 | $222,429 |
| 2022 | $4,435 | $362,896 | $144,828 | $218,068 |
| 2021 | $4,372 | $355,782 | $141,989 | $213,793 |
| 2020 | $4,390 | $352,135 | $140,534 | $211,601 |
| 2019 | $4,261 | $345,231 | $137,779 | $207,452 |
| 2018 | $4,175 | $338,463 | $135,078 | $203,385 |
| 2017 | $4,117 | $331,828 | $132,430 | $199,398 |
| 2016 | $3,873 | $325,323 | $129,834 | $195,489 |
| 2015 | $3,834 | $320,437 | $127,884 | $192,553 |
| 2014 | $3,606 | $314,161 | $125,379 | $188,782 |
Source: Public Records
Map
Nearby Homes