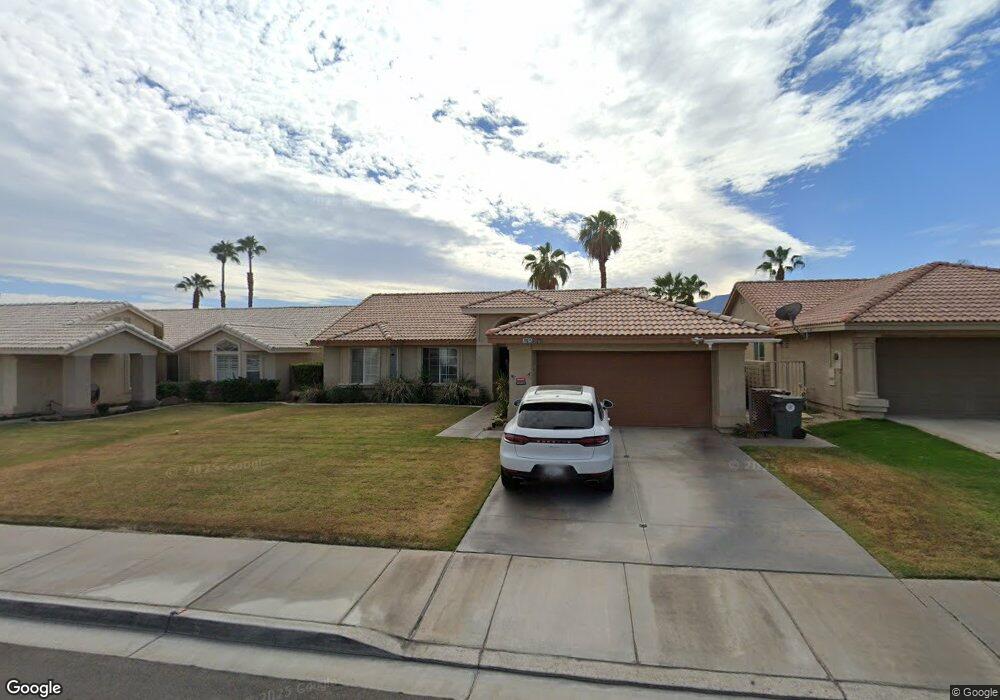
78825 Nolan Cir La Quinta, CA 92253
Estimated Value: $369,000 - $592,000
3
Beds
2
Baths
1,400
Sq Ft
$342/Sq Ft
Est. Value
About This Home
This home is located at 78825 Nolan Cir, La Quinta, CA 92253 and is currently estimated at $478,564, approximately $341 per square foot. 78825 Nolan Cir is a home located in Riverside County with nearby schools including Gerald R. Ford Elementary School, John Glenn Middle School Of International Studies, and La Quinta High School.
Ownership History
Date
Name
Owned For
Owner Type
Purchase Details
Closed on
Apr 9, 1999
Sold by
Garcia John H and Garcia Dianna E
Bought by
Sherman Jim L
Current Estimated Value
Home Financials for this Owner
Home Financials are based on the most recent Mortgage that was taken out on this home.
Original Mortgage
$111,920
Outstanding Balance
$35,373
Interest Rate
10%
Mortgage Type
Purchase Money Mortgage
Estimated Equity
$443,191
Purchase Details
Closed on
May 23, 1996
Sold by
La Quinta Real Estate Development Partne
Bought by
Garcia John H and Garcia Dianna E
Home Financials for this Owner
Home Financials are based on the most recent Mortgage that was taken out on this home.
Original Mortgage
$115,900
Interest Rate
8.25%
Mortgage Type
FHA
Create a Home Valuation Report for This Property
The Home Valuation Report is an in-depth analysis detailing your home's value as well as a comparison with similar homes in the area
Home Values in the Area
Average Home Value in this Area
Purchase History
| Date | Buyer | Sale Price | Title Company |
|---|---|---|---|
| Sherman Jim L | $140,000 | Chicago Title Co | |
| Garcia John H | $117,000 | Chicago Title |
Source: Public Records
Mortgage History
| Date | Status | Borrower | Loan Amount |
|---|---|---|---|
| Open | Sherman Jim L | $111,920 | |
| Previous Owner | Garcia John H | $115,900 | |
| Closed | Sherman Jim L | $13,990 |
Source: Public Records
Tax History Compared to Growth
Tax History
| Year | Tax Paid | Tax Assessment Tax Assessment Total Assessment is a certain percentage of the fair market value that is determined by local assessors to be the total taxable value of land and additions on the property. | Land | Improvement |
|---|---|---|---|---|
| 2025 | $3,302 | $219,287 | $54,812 | $164,475 |
| 2023 | $3,302 | $210,774 | $52,685 | $158,089 |
| 2022 | $3,059 | $206,642 | $51,652 | $154,990 |
| 2021 | $2,973 | $202,591 | $50,640 | $151,951 |
| 2020 | $2,922 | $200,514 | $50,121 | $150,393 |
| 2019 | $2,862 | $196,584 | $49,139 | $147,445 |
| 2018 | $2,796 | $192,730 | $48,176 | $144,554 |
| 2017 | $2,752 | $188,952 | $47,232 | $141,720 |
| 2016 | $2,701 | $185,248 | $46,306 | $138,942 |
| 2015 | $2,706 | $182,467 | $45,611 | $136,856 |
| 2014 | $2,664 | $178,894 | $44,718 | $134,176 |
Source: Public Records
Map
Nearby Homes
- 78670 Bradford Cir
- 78640 Alden Cir
- 45245 Seeley Dr Unit 15G
- 45245 Seeley Dr Unit 17A
- 79030 Ladera Dr
- 78755 Villeta Dr
- 44865 Via Alondra
- 44830 Via Mirabel
- 78440 Via Palomino
- 79185 Canterra Cir
- 78487 Magenta Dr
- 78379 Terra Cotta Ct Unit 109
- 79140 Fred Waring Dr
- 78373 Terra Cotta Ct Unit 106
- 78363 Terra Cotta Ct
- 79305 Desert Wind Ct
- 78347 Terra Cotta Ct
- 79300 Desert Stream Dr
- 44520 Via Terra Nova
- 79170 Starlight Ln
- 78835 Nolan Cir
- 78815 Nolan Cir
- 78805 Nolan Cir
- 78845 Nolan Cir
- 78795 Nolan Cir
- 78820 Nolan Cir
- 78810 Nolan Cir
- 78830 Nolan Cir
- 78800 Nolan Cir
- 78840 Nolan Cir
- 78785 Nolan Cir
- 78790 Nolan Cir
- 78790 Sunbrook Ln
- 78780 Sunbrook Ln
- 78810 Sunbrook Ln
- 78775 Nolan Cir
- 78780 Nolan Cir
- 78825 Lowe Dr
- 78835 Lowe Dr
- 78815 Lowe Dr