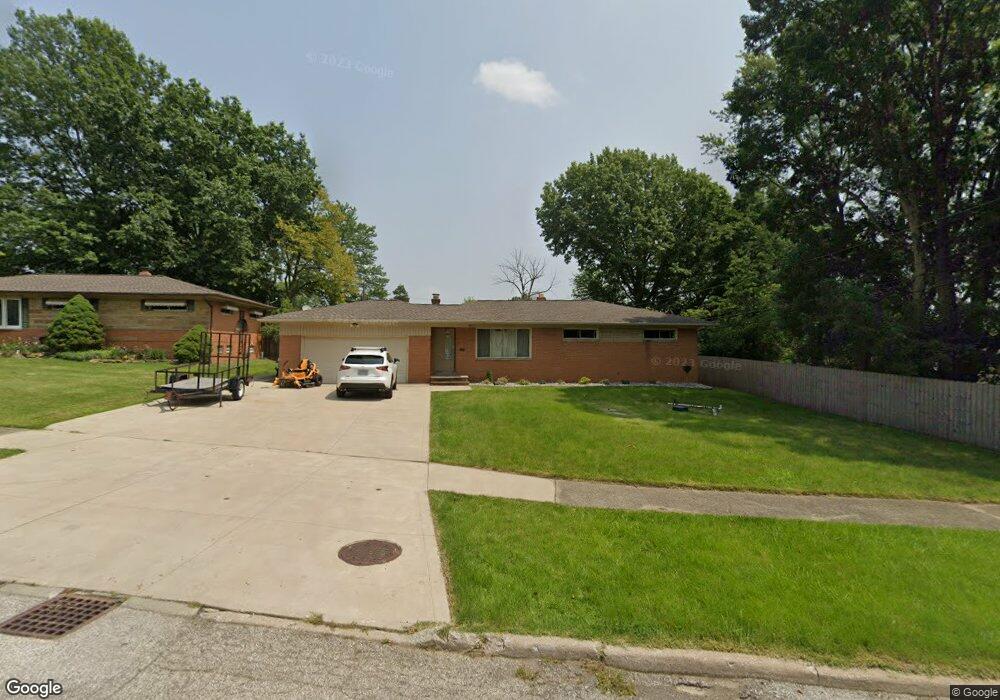
7885 Parmaview Ln Cleveland, OH 44134
Estimated Value: $237,000 - $303,000
3
Beds
2
Baths
1,301
Sq Ft
$201/Sq Ft
Est. Value
About This Home
This home is located at 7885 Parmaview Ln, Cleveland, OH 44134 and is currently estimated at $262,105, approximately $201 per square foot. 7885 Parmaview Ln is a home located in Cuyahoga County with nearby schools including Green Valley Elementary School, Normandy High School, and Hillside Middle School.
Ownership History
Date
Name
Owned For
Owner Type
Purchase Details
Closed on
Dec 21, 2011
Sold by
Popovic Veselin and Popovic Natasa
Bought by
Popovic Veselin and Popovic Natasa
Current Estimated Value
Purchase Details
Closed on
May 5, 2008
Sold by
Popovic Veselin
Bought by
Popovic Natasa and Popovic Veselin
Purchase Details
Closed on
May 5, 2000
Sold by
Holyk Katharina
Bought by
Popovic Veselin
Home Financials for this Owner
Home Financials are based on the most recent Mortgage that was taken out on this home.
Original Mortgage
$116,000
Interest Rate
8.26%
Purchase Details
Closed on
Aug 23, 1990
Sold by
Holyk Paul
Bought by
Holyk Katharina
Purchase Details
Closed on
Oct 17, 1988
Sold by
Mackey Charles H
Bought by
Holyk Paul
Purchase Details
Closed on
Jun 12, 1981
Sold by
Haynes Ray P and Haynes Marie B
Bought by
Mackey Charles H
Purchase Details
Closed on
Jan 1, 1975
Bought by
Haynes Ray P and Haynes Marie B
Create a Home Valuation Report for This Property
The Home Valuation Report is an in-depth analysis detailing your home's value as well as a comparison with similar homes in the area
Home Values in the Area
Average Home Value in this Area
Purchase History
| Date | Buyer | Sale Price | Title Company |
|---|---|---|---|
| Popovic Veselin | -- | None Available | |
| Popovic Natasa | -- | Attorney | |
| Popovic Veselin | $145,000 | -- | |
| Holyk Katharina | -- | -- | |
| Holyk Paul | $115,000 | -- | |
| Mackey Charles H | $80,000 | -- | |
| Haynes Ray P | -- | -- |
Source: Public Records
Mortgage History
| Date | Status | Borrower | Loan Amount |
|---|---|---|---|
| Closed | Popovic Veselin | $116,000 |
Source: Public Records
Tax History Compared to Growth
Tax History
| Year | Tax Paid | Tax Assessment Tax Assessment Total Assessment is a certain percentage of the fair market value that is determined by local assessors to be the total taxable value of land and additions on the property. | Land | Improvement |
|---|---|---|---|---|
| 2024 | $4,523 | $76,405 | $16,205 | $60,200 |
| 2023 | $3,858 | $54,820 | $11,030 | $43,790 |
| 2022 | $3,899 | $54,810 | $11,025 | $43,785 |
| 2021 | $4,171 | $54,810 | $11,030 | $43,790 |
| 2020 | $3,522 | $42,810 | $8,610 | $34,200 |
| 2019 | $3,365 | $122,300 | $24,600 | $97,700 |
| 2018 | $3,119 | $42,810 | $8,610 | $34,200 |
| 2017 | $3,132 | $36,790 | $5,920 | $30,870 |
| 2016 | $3,003 | $36,790 | $5,920 | $30,870 |
| 2015 | $2,845 | $36,790 | $5,920 | $30,870 |
| 2014 | $2,845 | $36,790 | $5,920 | $30,870 |
Source: Public Records
Map
Nearby Homes
- 3350 Saint Andrews Dr
- 7791 Hoertz Rd
- 7744 Cecelia Dr
- 2330 Judy Dr
- 2830 Brian Dr
- 8076 Twin Oaks Dr
- 3225 Helen Dr
- 2800 Bonny Blvd
- 7558 Pleasant View Dr
- 9135 Vista Dr
- 4440 Coral Gables Dr
- 8053 Thornhurst Dr
- 4591 W Sprague Rd
- 1658 Winterpark Dr
- 4402 Stary Dr
- 1881 W Pleasant Valley Rd
- 7531 Vista Dr
- 10060 Brookside Cir
- 9741 Royal Valley Dr
- 6035 Woodland Bend Dr
- 7869 Parmaview Ln
- 3036 W Sprague Rd
- 3040 W Sprague Rd
- 7859 Parmaview Ln
- 3020 W Sprague Rd
- 7880 Hoertz Rd
- 7870 Hoertz Rd
- 3010 W Sprague Rd
- 7851 Parmaview Ln
- 7880 Parmaview Ln
- 3070 W Sprague Rd
- 7860 Hoertz Rd
- 7866 Parmaview Ln
- 3000 W Sprague Rd
- 7850 Hoertz Rd
- 7856 Parmaview Ln
- 3100 W Sprague Rd
- 7839 Parmaview Ln
- 7840 Hoertz Rd
- 7842 Parmaview Ln