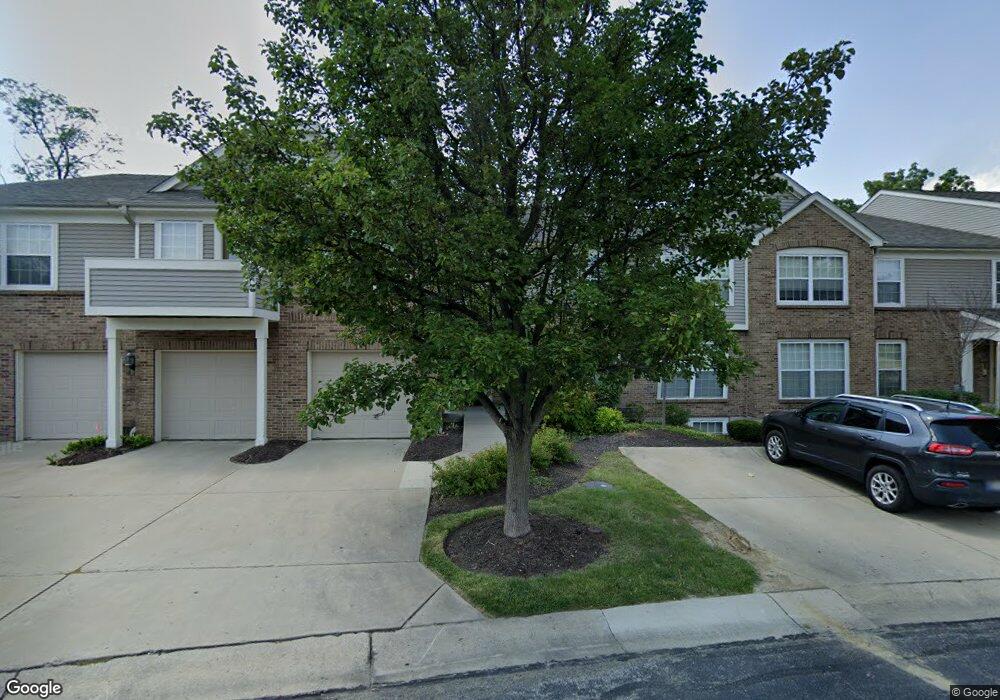
7885 Ramble View Unit 4201 Cincinnati, OH 45231
Finneytown NeighborhoodEstimated Value: $202,000 - $350,000
2
Beds
2
Baths
1,351
Sq Ft
$187/Sq Ft
Est. Value
About This Home
This home is located at 7885 Ramble View Unit 4201, Cincinnati, OH 45231 and is currently estimated at $252,825, approximately $187 per square foot. 7885 Ramble View Unit 4201 is a home located in Hamilton County with nearby schools including Finneytown Elementary School, Finneytown Secondary Campus, and St. Vivian School.
Ownership History
Date
Name
Owned For
Owner Type
Purchase Details
Closed on
Jul 31, 2019
Sold by
Bartholomew Hale
Bought by
Merriman Charlene
Current Estimated Value
Purchase Details
Closed on
Dec 9, 2011
Sold by
Blum Vierling A
Bought by
Bartholomew Hale
Purchase Details
Closed on
Apr 30, 2003
Sold by
Menze Dolores B
Bought by
Blum Vierling A and Blum Marian G
Purchase Details
Closed on
Jan 3, 2002
Sold by
Steele Rebecca N
Bought by
Bayer Dolores E
Home Financials for this Owner
Home Financials are based on the most recent Mortgage that was taken out on this home.
Original Mortgage
$100,000
Interest Rate
5.5%
Purchase Details
Closed on
Jul 29, 1999
Sold by
Fischer Attached Homes Ltd
Bought by
Nafziger Betty O and The Betty Nafziger Revocable Living Tr
Home Financials for this Owner
Home Financials are based on the most recent Mortgage that was taken out on this home.
Original Mortgage
$75,000
Interest Rate
7.69%
Create a Home Valuation Report for This Property
The Home Valuation Report is an in-depth analysis detailing your home's value as well as a comparison with similar homes in the area
Home Values in the Area
Average Home Value in this Area
Purchase History
| Date | Buyer | Sale Price | Title Company |
|---|---|---|---|
| Merriman Charlene | $120,000 | None Available | |
| Bartholomew Hale | $93,000 | Terry Monnie Title | |
| Blum Vierling A | -- | Terry Monnie Title | |
| Blum Vierling A | $149,500 | -- | |
| Bayer Dolores E | $136,000 | -- | |
| Nafziger Betty O | $126,100 | Homestead Title Agency Inc |
Source: Public Records
Mortgage History
| Date | Status | Borrower | Loan Amount |
|---|---|---|---|
| Previous Owner | Bayer Dolores E | $100,000 | |
| Previous Owner | Nafziger Betty O | $75,000 |
Source: Public Records
Tax History
| Year | Tax Paid | Tax Assessment Tax Assessment Total Assessment is a certain percentage of the fair market value that is determined by local assessors to be the total taxable value of land and additions on the property. | Land | Improvement |
|---|---|---|---|---|
| 2025 | $4,248 | $60,883 | $8,960 | $51,923 |
| 2023 | $4,081 | $60,883 | $8,960 | $51,923 |
| 2022 | $3,883 | $42,000 | $6,832 | $35,168 |
| 2021 | $3,814 | $42,000 | $6,832 | $35,168 |
| 2020 | $3,870 | $42,000 | $6,832 | $35,168 |
| 2019 | $3,321 | $32,123 | $5,600 | $26,523 |
| 2018 | $3,073 | $32,123 | $5,600 | $26,523 |
| 2017 | $2,973 | $32,123 | $5,600 | $26,523 |
| 2016 | $3,103 | $32,550 | $4,368 | $28,182 |
| 2015 | $3,073 | $32,550 | $4,368 | $28,182 |
| 2014 | $3,069 | $32,550 | $4,368 | $28,182 |
| 2013 | $3,897 | $42,735 | $5,600 | $37,135 |
Source: Public Records
Map
Nearby Homes
- 7946 Fairhope Ct
- 7790 Fancycab Ct Unit 14302
- 712 W Galbraith Rd
- 720 Castlegate Ln
- 704 W Galbraith Rd
- 7809 View Place Dr
- 833 W Galbraith Rd
- 838 W Galbraith Rd
- 810 Southmeadow Cir
- 852 Finney Trail
- 741 W North Bend Rd
- 816 Sabino Ct
- 8674 Hollyhock Dr
- 7281 Winton Rd
- 6848 Somerset Dr
- 6837 Warder Dr
- 6781 Somerset Dr
- 206 Hilltop Ln
- 8768 Cavalier Dr
- 1006 Hearthstone Dr
- 7887 Ramble View Unit 203
- 7887 Ramble View Unit 4104
- 7885 Ramble View
- 7887 Ramble View Unit 4103
- 7885 Ramble View
- 7885 Ramble View Unit 4302
- 7887 Ramble View Unit 4304
- 7887 Ramble View Unit 4G8
- 7887 Ramble View Unit 4204
- 7885 Ramble View Unit 4302
- 7887 Ramble View Unit 4304
- 7887 Ramble View Unit 4203
- 7887 Ramble View Unit 303
- 7885 Ramble View Unit 4301
- 7885 Ramble View Unit 202
- 7885 Ramble View Unit 202
- 7885 Ramble View Unit 4301
- 7887 Ramble View Unit 4203
- 7887 Ramble View Unit 303
- 7885 Ramble View Unit 4300
Your Personal Tour Guide
Ask me questions while you tour the home.