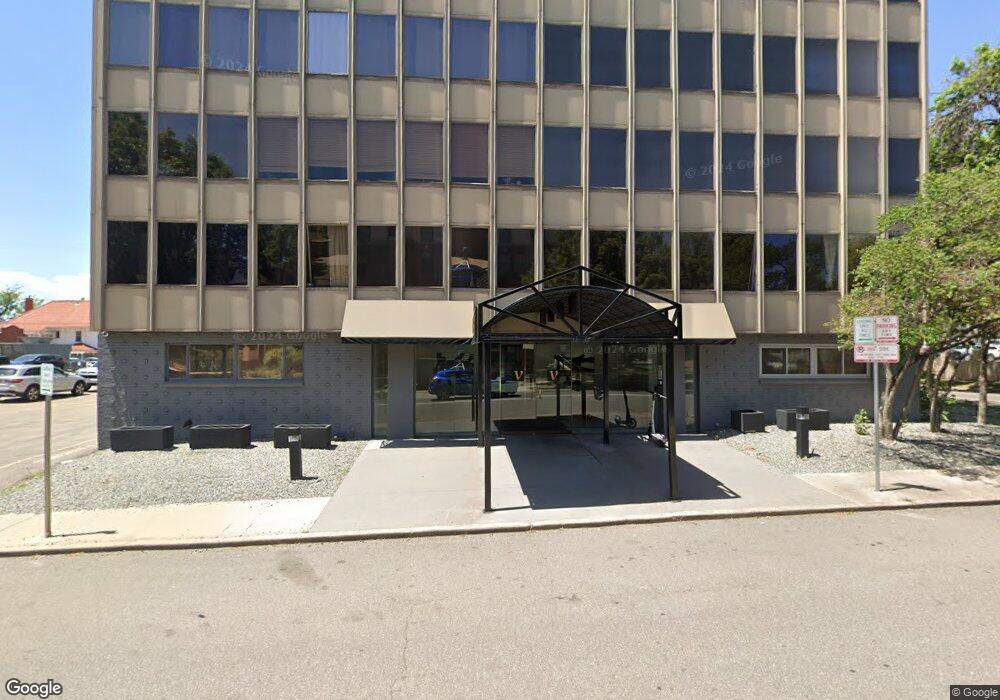
789 Clarkson St Unit PH1 Denver, CO 80218
Capitol Hill NeighborhoodEstimated Value: $397,858 - $455,000
3
Beds
2
Baths
938
Sq Ft
$463/Sq Ft
Est. Value
About This Home
This home is located at 789 Clarkson St Unit PH1, Denver, CO 80218 and is currently estimated at $434,215, approximately $462 per square foot. 789 Clarkson St Unit PH1 is a home located in Denver County with nearby schools including Dora Moore ECE-8 School, Morey Middle School, and East High School.
Ownership History
Date
Name
Owned For
Owner Type
Purchase Details
Closed on
May 5, 2017
Sold by
Ward Kevin G
Bought by
Grant Bryan
Current Estimated Value
Purchase Details
Closed on
Aug 8, 2012
Sold by
Elwood Industries Limited
Bought by
Ward Kevin G
Purchase Details
Closed on
Jun 2, 2011
Sold by
Ward Kevin G
Bought by
Elwood Industries Limited
Purchase Details
Closed on
Jul 14, 2005
Sold by
Adi Tarek K
Bought by
Ward Kevin G
Home Financials for this Owner
Home Financials are based on the most recent Mortgage that was taken out on this home.
Original Mortgage
$42,000
Interest Rate
5.61%
Mortgage Type
Stand Alone Second
Purchase Details
Closed on
Dec 20, 2001
Sold by
Wright Properties Ltd
Bought by
Adi Tarek K
Home Financials for this Owner
Home Financials are based on the most recent Mortgage that was taken out on this home.
Original Mortgage
$180,000
Interest Rate
7.99%
Purchase Details
Closed on
Jun 12, 2000
Sold by
789 Clarkson Llc
Bought by
Wright Properties Ltd
Home Financials for this Owner
Home Financials are based on the most recent Mortgage that was taken out on this home.
Original Mortgage
$127,120
Interest Rate
8.5%
Create a Home Valuation Report for This Property
The Home Valuation Report is an in-depth analysis detailing your home's value as well as a comparison with similar homes in the area
Home Values in the Area
Average Home Value in this Area
Purchase History
| Date | Buyer | Sale Price | Title Company |
|---|---|---|---|
| Grant Bryan | $365,000 | First Integrity Title | |
| Ward Kevin G | -- | None Available | |
| Elwood Industries Limited | -- | None Available | |
| Ward Kevin G | $210,000 | -- | |
| Adi Tarek K | $225,000 | Land Title | |
| Wright Properties Ltd | $158,900 | -- |
Source: Public Records
Mortgage History
| Date | Status | Borrower | Loan Amount |
|---|---|---|---|
| Previous Owner | Ward Kevin G | $42,000 | |
| Previous Owner | Ward Kevin G | $168,000 | |
| Previous Owner | Adi Tarek K | $180,000 | |
| Previous Owner | Wright Properties Ltd | $127,120 |
Source: Public Records
Tax History Compared to Growth
Tax History
| Year | Tax Paid | Tax Assessment Tax Assessment Total Assessment is a certain percentage of the fair market value that is determined by local assessors to be the total taxable value of land and additions on the property. | Land | Improvement |
|---|---|---|---|---|
| 2024 | $2,265 | $28,600 | $2,310 | $26,290 |
| 2023 | $2,216 | $28,600 | $2,310 | $26,290 |
| 2022 | $2,538 | $31,920 | $2,400 | $29,520 |
| 2021 | $2,450 | $32,840 | $2,470 | $30,370 |
| 2020 | $2,111 | $28,450 | $2,470 | $25,980 |
| 2019 | $2,052 | $28,450 | $2,470 | $25,980 |
| 2018 | $1,937 | $25,040 | $1,740 | $23,300 |
| 2017 | $1,931 | $25,040 | $1,740 | $23,300 |
| 2016 | $1,844 | $22,610 | $1,648 | $20,962 |
| 2015 | $1,766 | $22,610 | $1,648 | $20,962 |
| 2014 | $1,360 | $16,370 | $1,831 | $14,539 |
Source: Public Records
Map
Nearby Homes
- 800 N Washington St Unit 403
- 800 N Washington St Unit 302
- 800 N Washington St Unit 409
- 800 N Washington St Unit 307
- 790 N Washington St Unit 206
- 790 N Washington St Unit 305
- 790 N Washington St Unit 1105
- 790 N Washington St Unit 1004
- 789 N Clarkson St Unit 406
- 800 N Pearl St Unit 206
- 800 N Pearl St Unit 809
- 800 N Pearl St Unit 1211
- 800 N Pearl St Unit 803
- 800 N Pearl St Unit 1109
- 800 N Pearl St Unit 709
- 800 N Pearl St Unit 702
- 800 N Pearl St Unit 602
- 800 Pearl St Unit 1010
- 777 N Washington St Unit 508
- 777 N Washington St Unit 204
- 789 Clarkson St Unit 701
- 789 Clarkson St Unit R1
- 789 Clarkson St Unit PH6
- 789 Clarkson St Unit PH5
- 789 Clarkson St Unit PH4
- 789 Clarkson St Unit PH2
- 789 Clarkson St Unit 1006
- 789 Clarkson St Unit 1005
- 789 Clarkson St Unit 1004
- 789 Clarkson St Unit 1002
- 789 Clarkson St Unit 1001
- 789 Clarkson St Unit 906
- 789 Clarkson St Unit 905
- 789 Clarkson St Unit 904
- 789 Clarkson St Unit 902
- 789 Clarkson St Unit 901
- 789 Clarkson St Unit 806
- 789 Clarkson St
- 789 Clarkson St Unit 804
- 789 Clarkson St Unit 802