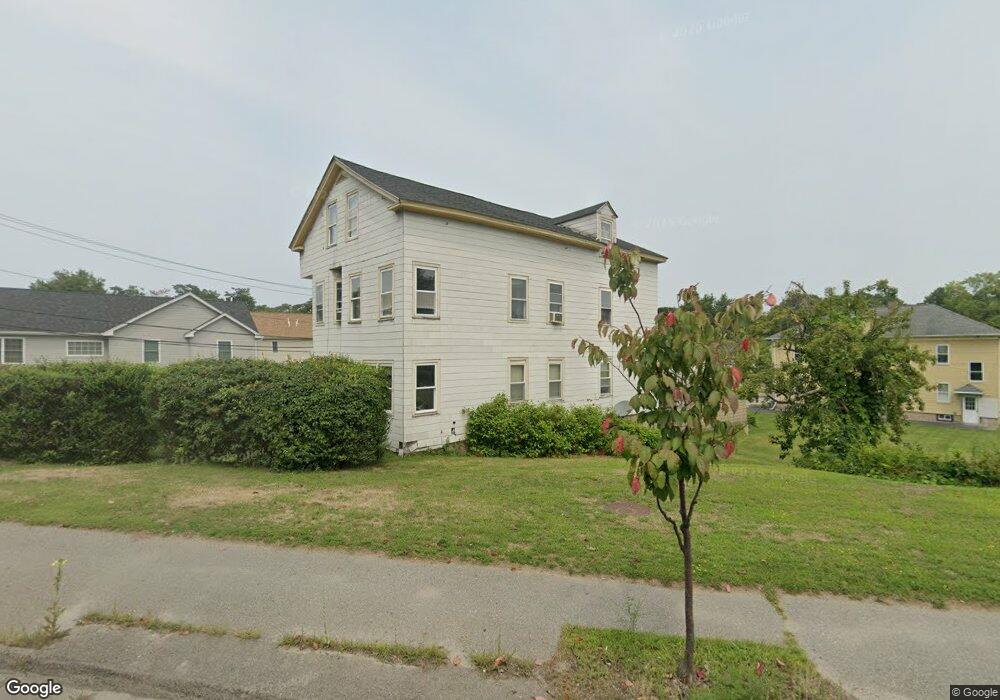
789 Grafton St Worcester, MA 01604
Grafton Hill NeighborhoodEstimated Value: $530,049 - $582,000
8
Beds
3
Baths
2,364
Sq Ft
$232/Sq Ft
Est. Value
About This Home
This home is located at 789 Grafton St, Worcester, MA 01604 and is currently estimated at $548,762, approximately $232 per square foot. 789 Grafton St is a home located in Worcester County with nearby schools including Roosevelt Elementary School, Jacob Hiatt Magnet School, and Chandler Magnet.
Ownership History
Date
Name
Owned For
Owner Type
Purchase Details
Closed on
May 5, 2009
Sold by
Parvin Kevin and Parvin Kiumars
Bought by
Parvin Homes Llc
Current Estimated Value
Purchase Details
Closed on
Oct 7, 2005
Sold by
Dascanio Angelo and Dascanio Anthony
Bought by
Parvin Kiumars
Home Financials for this Owner
Home Financials are based on the most recent Mortgage that was taken out on this home.
Original Mortgage
$240,000
Interest Rate
5.81%
Mortgage Type
Purchase Money Mortgage
Create a Home Valuation Report for This Property
The Home Valuation Report is an in-depth analysis detailing your home's value as well as a comparison with similar homes in the area
Home Values in the Area
Average Home Value in this Area
Purchase History
| Date | Buyer | Sale Price | Title Company |
|---|---|---|---|
| Parvin Homes Llc | -- | -- | |
| Parvin Kiumars | $300,000 | -- |
Source: Public Records
Mortgage History
| Date | Status | Borrower | Loan Amount |
|---|---|---|---|
| Previous Owner | Parvin Kiumars | $240,000 |
Source: Public Records
Tax History
| Year | Tax Paid | Tax Assessment Tax Assessment Total Assessment is a certain percentage of the fair market value that is determined by local assessors to be the total taxable value of land and additions on the property. | Land | Improvement |
|---|---|---|---|---|
| 2025 | $5,516 | $418,200 | $118,700 | $299,500 |
| 2024 | $5,220 | $379,600 | $118,700 | $260,900 |
| 2023 | $4,967 | $346,400 | $103,200 | $243,200 |
| 2022 | $4,345 | $285,700 | $82,600 | $203,100 |
| 2021 | $4,062 | $249,500 | $66,100 | $183,400 |
| 2020 | $3,859 | $227,000 | $66,100 | $160,900 |
| 2019 | $3,852 | $214,000 | $59,500 | $154,500 |
| 2018 | $3,708 | $196,100 | $59,500 | $136,600 |
| 2017 | $3,550 | $184,700 | $59,500 | $125,200 |
| 2016 | $3,318 | $161,000 | $43,600 | $117,400 |
| 2015 | $3,231 | $161,000 | $43,600 | $117,400 |
| 2014 | $3,146 | $161,000 | $43,600 | $117,400 |
Source: Public Records
Map
Nearby Homes
- 12 Benham St
- 143 Commonwealth Ave
- 16 Arborwood Dr
- 21 Middlesex Ave Unit 102
- 41 Modoc St
- Lot B Crawford St
- 19 Middlesex Ave
- 53 Denver Terrace
- 143 Dorcester
- 360 Hamilton St
- 25 Stoneham Rd
- 496 Hamilton St
- 340 Sunderland Rd Unit 28
- 83 Massasoit Rd
- 62 Allston Ave
- 330 Sunderland Rd Unit 80
- 259 Massasoit Rd
- 20 Brightwood Ave
- 80 Delmont Ave
- 256 Massasoit Rd
Your Personal Tour Guide
Ask me questions while you tour the home.