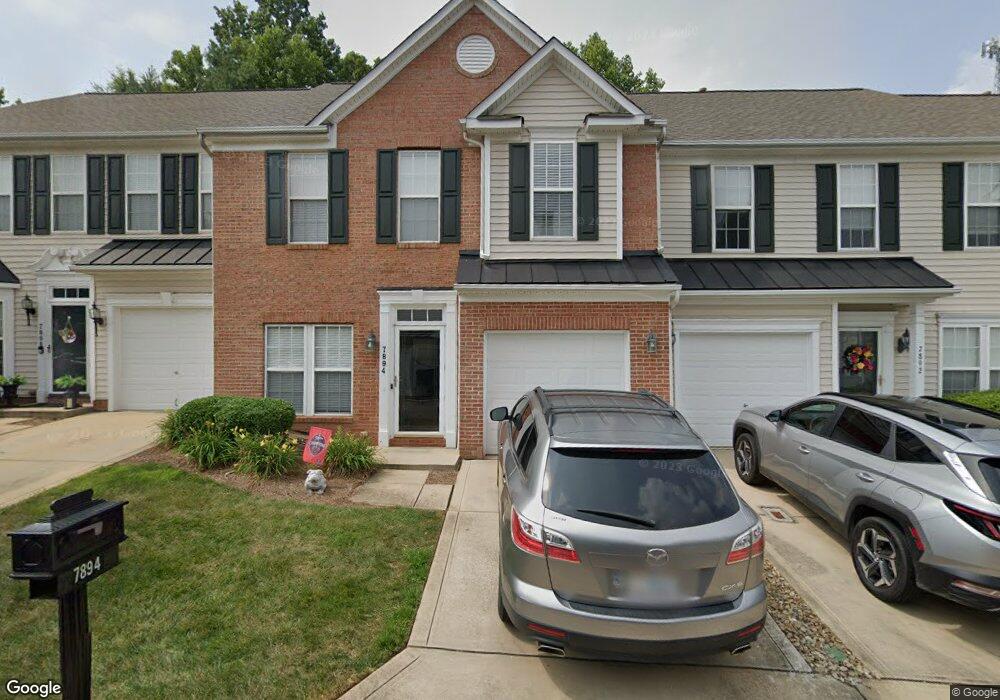
7894 Mariners Pointe Cir Denver, NC 28037
Estimated Value: $278,562 - $310,000
3
Beds
2
Baths
1,666
Sq Ft
$177/Sq Ft
Est. Value
About This Home
This home is located at 7894 Mariners Pointe Cir, Denver, NC 28037 and is currently estimated at $295,141, approximately $177 per square foot. 7894 Mariners Pointe Cir is a home located in Lincoln County with nearby schools including St. James Elementary School, East Lincoln Middle School, and East Lincoln High School.
Ownership History
Date
Name
Owned For
Owner Type
Purchase Details
Closed on
Jul 21, 2020
Sold by
Harris Michael
Bought by
Little Kristen M
Current Estimated Value
Home Financials for this Owner
Home Financials are based on the most recent Mortgage that was taken out on this home.
Original Mortgage
$157,712
Outstanding Balance
$139,849
Interest Rate
3.1%
Mortgage Type
FHA
Estimated Equity
$155,292
Purchase Details
Closed on
Dec 21, 2017
Sold by
Stamey Cammie R and Stamey Michael
Bought by
Harris Michael
Home Financials for this Owner
Home Financials are based on the most recent Mortgage that was taken out on this home.
Original Mortgage
$149,600
Interest Rate
3.95%
Mortgage Type
New Conventional
Purchase Details
Closed on
Dec 4, 2002
Bought by
Hunt Lahona
Purchase Details
Closed on
Sep 9, 2002
Bought by
Nvr Inc
Create a Home Valuation Report for This Property
The Home Valuation Report is an in-depth analysis detailing your home's value as well as a comparison with similar homes in the area
Purchase History
| Date | Buyer | Sale Price | Title Company |
|---|---|---|---|
| Little Kristen M | $205,000 | None Available | |
| Harris Michael | $190,000 | None Available | |
| Hunt Lahona | $126,500 | -- | |
| Nvr Inc | $119,000 | -- |
Source: Public Records
Mortgage History
| Date | Status | Borrower | Loan Amount |
|---|---|---|---|
| Open | Little Kristen M | $157,712 | |
| Previous Owner | Harris Michael | $149,600 |
Source: Public Records
Tax History
| Year | Tax Paid | Tax Assessment Tax Assessment Total Assessment is a certain percentage of the fair market value that is determined by local assessors to be the total taxable value of land and additions on the property. | Land | Improvement |
|---|---|---|---|---|
| 2025 | $1,833 | $280,229 | $37,000 | $243,229 |
| 2024 | $1,805 | $280,229 | $37,000 | $243,229 |
| 2023 | $1,800 | $280,229 | $37,000 | $243,229 |
| 2022 | $1,344 | $166,318 | $30,000 | $136,318 |
| 2021 | $1,352 | $166,318 | $30,000 | $136,318 |
| 2020 | $1,159 | $166,318 | $30,000 | $136,318 |
| 2019 | $1,159 | $166,318 | $30,000 | $136,318 |
| 2018 | $1,043 | $134,594 | $23,500 | $111,094 |
| 2017 | $942 | $134,594 | $23,500 | $111,094 |
| 2016 | $938 | $134,594 | $23,500 | $111,094 |
| 2015 | $1,047 | $134,594 | $23,500 | $111,094 |
| 2014 | $1,018 | $136,427 | $20,000 | $116,427 |
Source: Public Records
Map
Nearby Homes
- 7892 Mariners Pointe Cir
- 7978 Mariners Pointe Cir
- 7948 Mariners Pointe Cir
- 2833 Sand Cove Ct
- 2440 Mariners Cove Ln
- 7958 Unity Church Rd
- 2344 Smith Cove Rd
- 7380 Latham Way
- 7200 Indigo Way
- 2378 Smith Harbour Dr
- 2550 Green Point Ln
- 2028 Rock Springs Cir
- 6859 Lakecrest Ct
- 2325 Perry Rd
- 2514 Smith Harbour Dr
- 1751 Knights Dr
- 2456 W Nicole Ln
- 7208 Ogden Place
- 7217 Kenyon Dr
- 7532 W Berkeley Rd Unit 25
- 7892 Mariners Pointe Cir Unit 3
- 7896 Mariners Pointe Cir
- 7890 Mariners Pointe Cir
- 7888 Mariners Pointe Cir
- 7900 Mariners Pointe Cir
- 7900 Mariners Pointe Cir Unit 7900
- 2145 Lake Breeze Ln
- 7902 Mariners Pointe Cir
- 7902 Mariners Pointe Cir Unit E
- 7883 Mariners Pointe Cir Unit 54
- 7883 Mariners Pointe Cir
- 7904 Mariners Pointe Cir
- 7904 Mariners Pointe Cir Unit C
- 7904 Mariners Pointe Cir Unit 8
- 2149 Lake Breeze Ln
- 7881 Mariners Pointe Cir Unit 7881
- 7881 Mariners Pointe Cir Unit A
- 7881 Mariners Pointe Cir Unit 53
- 2151 Lake Breeze Ln
- 7906 Mariners Pointe Cir
Your Personal Tour Guide
Ask me questions while you tour the home.