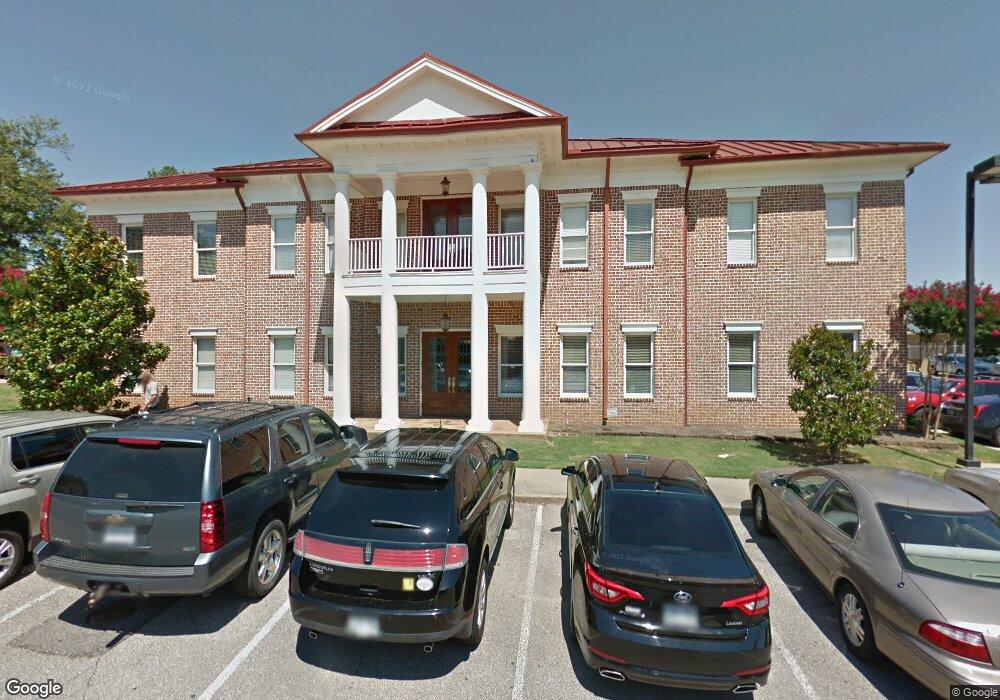
7894 Winchester Rd Memphis, TN 38125
Southern Shelby County NeighborhoodEstimated Value: $772,810
--
Bed
--
Bath
7,726
Sq Ft
$100/Sq Ft
Est. Value
About This Home
This home is located at 7894 Winchester Rd, Memphis, TN 38125 and is currently estimated at $772,810, approximately $100 per square foot. 7894 Winchester Rd is a home located in Shelby County with nearby schools including Oak Forest Elementary, Ridgeway Middle School, and Ridgeway High School.
Ownership History
Date
Name
Owned For
Owner Type
Purchase Details
Closed on
May 24, 2021
Sold by
Perfect Ventures Inc
Bought by
White Star Holdings Llc
Current Estimated Value
Home Financials for this Owner
Home Financials are based on the most recent Mortgage that was taken out on this home.
Original Mortgage
$455,000
Outstanding Balance
$411,047
Interest Rate
2.9%
Mortgage Type
Commercial
Estimated Equity
$361,763
Purchase Details
Closed on
Mar 29, 2019
Sold by
Williams Sandra G and Harrington Robert
Bought by
Rodgers Lisa
Home Financials for this Owner
Home Financials are based on the most recent Mortgage that was taken out on this home.
Original Mortgage
$90,600
Interest Rate
4.3%
Mortgage Type
FHA
Purchase Details
Closed on
May 18, 2018
Sold by
Cistrunk Angela K
Bought by
Decs Investment Llc
Purchase Details
Closed on
Dec 9, 2015
Sold by
Rdmw Llc
Bought by
Perfect Ventures Inc
Home Financials for this Owner
Home Financials are based on the most recent Mortgage that was taken out on this home.
Original Mortgage
$100,000
Interest Rate
3.83%
Mortgage Type
Commercial
Create a Home Valuation Report for This Property
The Home Valuation Report is an in-depth analysis detailing your home's value as well as a comparison with similar homes in the area
Home Values in the Area
Average Home Value in this Area
Purchase History
| Date | Buyer | Sale Price | Title Company |
|---|---|---|---|
| White Star Holdings Llc | $675,000 | Preferred Title & Escrow Ins | |
| Rodgers Lisa | $103,000 | Edco Ttl & Closing Svcs Inc | |
| Decs Investment Llc | $11,000 | Preferred Title & Escrow Llc | |
| Perfect Ventures Inc | $660,000 | Attorney |
Source: Public Records
Mortgage History
| Date | Status | Borrower | Loan Amount |
|---|---|---|---|
| Open | White Star Holdings Llc | $455,000 | |
| Previous Owner | Rodgers Lisa | $90,600 | |
| Previous Owner | Perfect Ventures Inc | $100,000 |
Source: Public Records
Tax History Compared to Growth
Tax History
| Year | Tax Paid | Tax Assessment Tax Assessment Total Assessment is a certain percentage of the fair market value that is determined by local assessors to be the total taxable value of land and additions on the property. | Land | Improvement |
|---|---|---|---|---|
| 2025 | $10,476 | $314,440 | $34,800 | $279,640 |
| 2024 | $10,476 | $309,040 | $27,680 | $281,360 |
| 2023 | $18,826 | $309,040 | $27,680 | $281,360 |
| 2022 | $18,826 | $309,040 | $27,680 | $281,360 |
| 2021 | $9,589 | $353,440 | $27,680 | $325,760 |
| 2020 | $19,367 | $267,280 | $27,680 | $239,600 |
| 2019 | $8,542 | $267,280 | $27,680 | $239,600 |
| 2018 | $8,542 | $267,280 | $27,680 | $239,600 |
| 2017 | $8,744 | $267,280 | $27,680 | $239,600 |
| 2016 | $11,318 | $259,000 | $0 | $0 |
| 2014 | $11,318 | $259,000 | $0 | $0 |
Source: Public Records
Map
Nearby Homes
- 7834 Winward Ln
- 7829 Gateway Inlet Cove
- 3507 Hacks Cove
- 7876 Winoak Ln
- 3515 Hacks Cross Rd
- 3821 Misty Oak Dr
- 3912 Autumn Harvest Ln
- 4028 Long Creek Rd
- 3988 Fern Valley Dr
- 7846 Players Club Pkwy
- 7579 Baysweet Dr
- 7582 Callis Creek Dr
- 7380 Isherwood Rd
- 3968 Sawgrass Dr
- 3155 Copiah Cove
- 4022 Muirfield Dr
- 7386 Eggleston Rd
- 0 Hacks Cross Rd
- 3279 Wind Shadow Cove
- 7753 October Rose Dr
- 7894 Winchester Hills
- 7900 Winchester Hills
- 7886 Winchester Hills
- 7886 Winchester Hills
- 7886 Winchester Hills
- 7900 Winchester Rd
- 3610 Chester Ln
- 3609 Chester Ln
- 3632 Wincross Dr
- 3642 Wincross Dr
- 3625 County Gate Rd
- 3624 Wincross Dr
- 3652 Wincross Dr
- 3606 Chester Ln
- 3615 County Gate Rd
- 3614 Wincross Dr
- 3603 Chester Ln
- 3606 Wincross Dr
- 3605 County Gate Rd
- 3598 Chester Ln