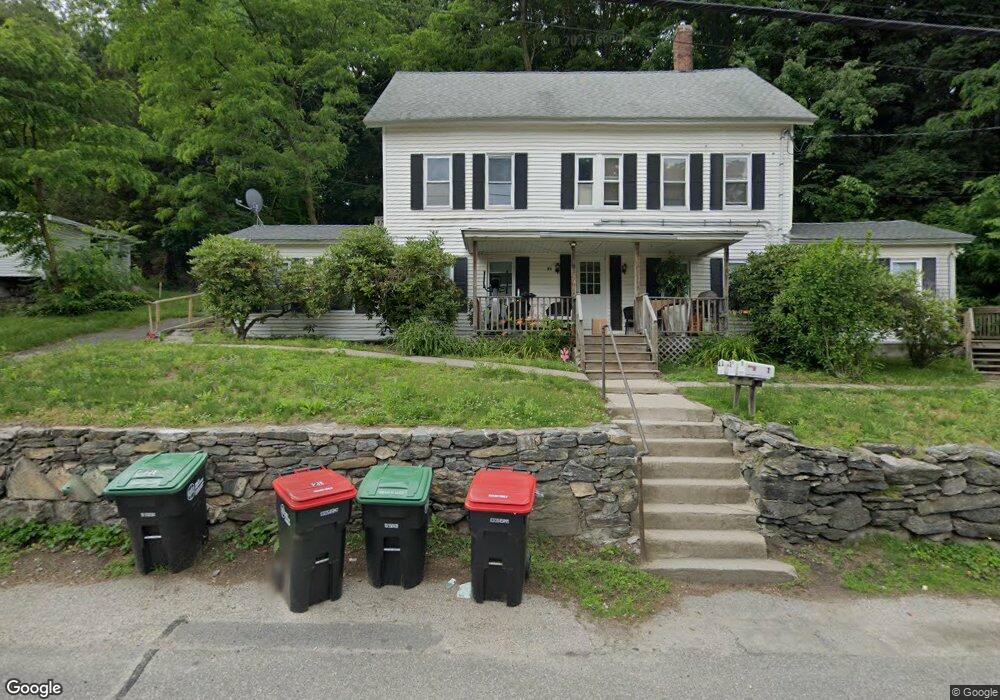
78A W Main St Unit C Millbury, MA 01527
Estimated Value: $496,060 - $598,000
6
Beds
3
Baths
2,364
Sq Ft
$235/Sq Ft
Est. Value
About This Home
This home is located at 78A W Main St Unit C, Millbury, MA 01527 and is currently estimated at $554,515, approximately $234 per square foot. 78A W Main St Unit C is a home located in Worcester County with nearby schools including Elmwood Street School, Raymond E. Shaw Elementary School, and Millbury Junior/Senior High School.
Ownership History
Date
Name
Owned For
Owner Type
Purchase Details
Closed on
Oct 6, 2021
Sold by
Kmh Ret and Brown
Bought by
Velasquez-Garcia Wiliam A
Current Estimated Value
Home Financials for this Owner
Home Financials are based on the most recent Mortgage that was taken out on this home.
Original Mortgage
$387,845
Outstanding Balance
$352,140
Interest Rate
2.8%
Mortgage Type
FHA
Estimated Equity
$202,375
Purchase Details
Closed on
Dec 5, 2012
Sold by
Kmb Real Estate Llc
Bought by
Kmh Rela T and Kmh Brown
Purchase Details
Closed on
Jul 20, 2012
Sold by
Wells Fargo Bank Na
Bought by
Kmb Real Estate Llc
Purchase Details
Closed on
May 25, 2010
Sold by
Page Linda L and Wells Fargo Bk
Bought by
Wells Fargo Bk
Purchase Details
Closed on
Oct 1, 2003
Sold by
Finne Angela K
Bought by
Page Linda L
Home Financials for this Owner
Home Financials are based on the most recent Mortgage that was taken out on this home.
Original Mortgage
$168,000
Interest Rate
6.25%
Mortgage Type
Purchase Money Mortgage
Create a Home Valuation Report for This Property
The Home Valuation Report is an in-depth analysis detailing your home's value as well as a comparison with similar homes in the area
Home Values in the Area
Average Home Value in this Area
Purchase History
| Date | Buyer | Sale Price | Title Company |
|---|---|---|---|
| Velasquez-Garcia Wiliam A | $395,000 | None Available | |
| Velasquez-Garcia Wiliam A | $395,000 | None Available | |
| Kmh Rela T | -- | -- | |
| Kmh Rela T | -- | -- | |
| Kmb Real Estate Llc | $80,000 | -- | |
| Kmb Real Estate Llc | $80,000 | -- | |
| Wells Fargo Bk | $161,325 | -- | |
| Wells Fargo Bk | $161,325 | -- | |
| Page Linda L | $240,000 | -- | |
| Page Linda L | $240,000 | -- |
Source: Public Records
Mortgage History
| Date | Status | Borrower | Loan Amount |
|---|---|---|---|
| Open | Velasquez-Garcia Wiliam A | $387,845 | |
| Closed | Velasquez-Garcia Wiliam A | $387,845 | |
| Previous Owner | Page Linda L | $168,000 | |
| Previous Owner | Page Linda L | $189,900 |
Source: Public Records
Tax History Compared to Growth
Tax History
| Year | Tax Paid | Tax Assessment Tax Assessment Total Assessment is a certain percentage of the fair market value that is determined by local assessors to be the total taxable value of land and additions on the property. | Land | Improvement |
|---|---|---|---|---|
| 2025 | $5,863 | $437,900 | $114,700 | $323,200 |
| 2024 | $5,363 | $405,400 | $106,300 | $299,100 |
| 2023 | $4,985 | $345,000 | $74,500 | $270,500 |
| 2022 | $4,338 | $289,200 | $74,500 | $214,700 |
| 2021 | $4,308 | $279,200 | $74,500 | $204,700 |
| 2020 | $4,219 | $275,200 | $74,500 | $200,700 |
| 2019 | $4,008 | $252,900 | $67,700 | $185,200 |
| 2018 | $3,730 | $228,300 | $67,700 | $160,600 |
| 2017 | $3,403 | $207,100 | $67,700 | $139,400 |
| 2016 | $3,169 | $192,500 | $67,700 | $124,800 |
| 2015 | $3,103 | $188,500 | $72,000 | $116,500 |
| 2014 | $2,970 | $173,700 | $72,000 | $101,700 |
Source: Public Records
Map
Nearby Homes
- 38 W Main St
- 124 Worcester Providence Turnpike
- 128 Worcester Providence Turnpike
- 40 River St
- 4 Jessica j Dr
- 23 Horne Way
- 192 Horne Way Unit 192
- 92 Horne Way
- 32 Horne Way
- 39 S Main St
- 2 Jessica j Dr
- 11 Laurel Dr
- 5 Mogren Dr
- 28 Brierly Cir
- 37-39 Main St
- 0 Auburn Rd
- 16 Jackie Dr
- 168 Burbank Rd
- 4 Thomas Hill Rd
- 18 Lincoln Ave