78B Linden St Unit 78C Exeter, NH 03833
Estimated Value: $587,000 - $720,000
About This Home
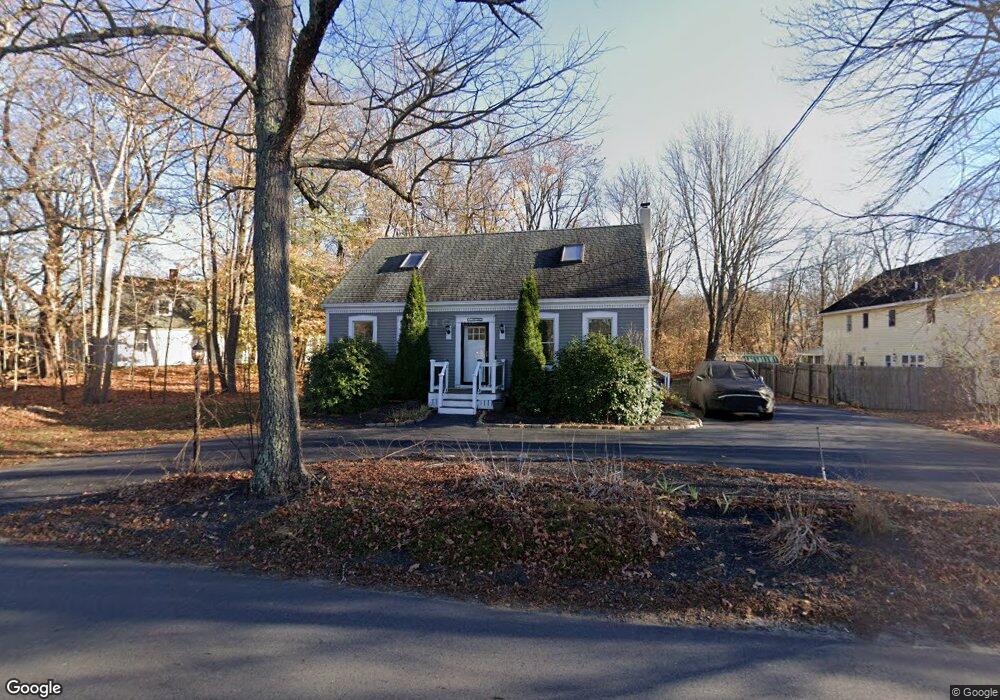
This home is located at 78B Linden St Unit 78C, Exeter, NH 03833 and is currently estimated at $649,214, approximately $359 per square foot. 78B Linden St Unit 78C is a home located in Rockingham County with nearby schools including Main Street School, Lincoln Street Elementary School, and Cooperative Middle School.
Ownership History
We collect this data history from publicly available records. To have your information removed, we recommend requesting removal directly through your county’s website.
Purchase Details
Home Financials for this Owner
Home Financials are based on the most recent Mortgage that was taken out on this home.Purchase Details
Purchase Details
Home Financials for this Owner
Home Financials are based on the most recent Mortgage that was taken out on this home.Home Values in the Area
Average Home Value in this Area
Purchase History
We collect this data history from publicly available records. To have your information removed, we recommend requesting removal directly through your county’s website.
| Date | Buyer | Sale Price | Title Company |
|---|---|---|---|
| -- | None Available | ||
| -- | None Available | ||
| $224,100 | -- | ||
| $150,000 | -- | ||
| $224,100 | -- | ||
| $150,000 | -- |
Mortgage History
We collect this data history from publicly available records. To have your information removed, we recommend requesting removal directly through your county’s website.
| Date | Status | Borrower | Loan Amount |
|---|---|---|---|
| Previous Owner | $234,700 | ||
| Previous Owner | $148,154 |
Tax History
We collect this data history from publicly available records. To have your information removed, we recommend requesting removal directly through your county’s website.
| Year | Tax Paid | Tax Assessment Tax Assessment Total Assessment is a certain percentage of the fair market value that is determined by local assessors to be the total taxable value of land and additions on the property. | Land | Improvement |
|---|---|---|---|---|
| 2025 | $10,290 | $548,500 | $253,400 | $295,100 |
| 2024 | $9,758 | $548,500 | $253,400 | $295,100 |
| 2023 | $8,851 | $330,500 | $149,100 | $181,400 |
| 2022 | $8,180 | $330,500 | $149,100 | $181,400 |
| 2021 | $7,796 | $324,700 | $149,100 | $175,600 |
| 2020 | $7,952 | $324,700 | $149,100 | $175,600 |
| 2019 | $7,556 | $324,700 | $149,100 | $175,600 |
| 2018 | $7,513 | $277,900 | $109,600 | $168,300 |
| 2017 | $7,439 | $277,900 | $109,600 | $168,300 |
| 2016 | $7,292 | $277,900 | $109,600 | $168,300 |
| 2015 | $7,098 | $277,900 | $109,600 | $168,300 |
| 2014 | $7,279 | $279,300 | $109,600 | $169,700 |
| 2013 | $7,270 | $279,300 | $109,600 | $169,700 |
| 2011 | $7,061 | $279,300 | $109,600 | $169,700 |
Map
- 17 Wayland Cir
- 23 Cypress Cir
- 3 Willow St
- 71 Linden St
- 21 Gary Ln
- 53 Hilton Ave
- 50 Hilton Ave
- 6 Patricia Ave
- 4 Dow St
- 137a Court St
- 132A Robinhood Dr
- 14 Sir Lancelot Dr
- 7 Sir Lancelot Dr
- 131 Court St Unit 17
- 614 Canterbury Dr
- 310 Friar Tuck Dr
- 422 Friar Tuck Dr
- 1013 Camelot Dr
- 24 Willey Creek Rd Unit 208
- 24 Willey Creek Rd Unit 203
- 78 Linden St Unit 78C
- 78 Linden St Unit D
- 78 Linden St Unit C
- 78 Linden St
- 78A Linden St
- 78B Linden St
- 78B Linden St
- 80 Linden St
- 87 Linden St
- 89 Linden St
- 89 Linden St Unit A
- 85 Linden St
- 4 Linden Fields
- 6 Linden Fields
- 9 Linden Fields
- 15 Linden Fields
- 5 Linden Fields
- 1 Willow St
- 84 Linden St
- 83 Linden St
Ask me questions while you tour the home.