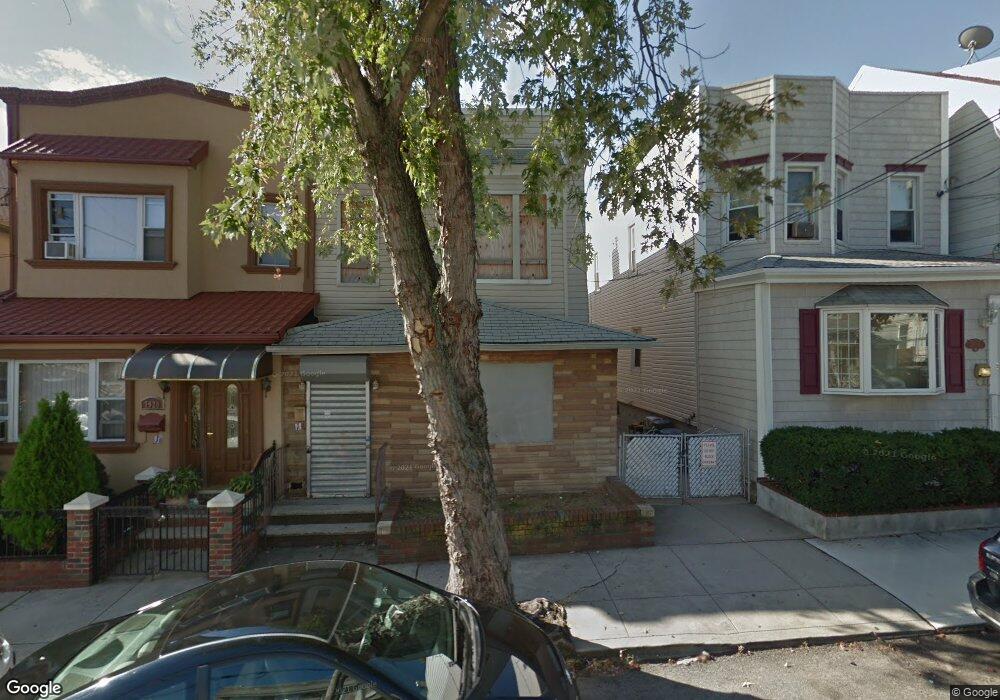
79-18 67th Rd Unit 2 Flushing, NY 11379
Middle Village NeighborhoodEstimated Value: $1,136,000 - $1,197,000
4
Beds
2
Baths
1,120
Sq Ft
$1,033/Sq Ft
Est. Value
About This Home
This home is located at 79-18 67th Rd Unit 2, Flushing, NY 11379 and is currently estimated at $1,157,435, approximately $1,033 per square foot. 79-18 67th Rd Unit 2 is a home located in Queens County with nearby schools including P.S. 87 - Middle Village, Queens Metropolitan High School, and St. Margaret Catholic Academy.
Ownership History
Date
Name
Owned For
Owner Type
Purchase Details
Closed on
Dec 17, 2024
Sold by
103 Home Llc
Bought by
Cabrega Biag Ivan Gil and Diaz Salinas Loraine
Current Estimated Value
Home Financials for this Owner
Home Financials are based on the most recent Mortgage that was taken out on this home.
Original Mortgage
$986,000
Outstanding Balance
$978,095
Interest Rate
6.69%
Mortgage Type
Purchase Money Mortgage
Estimated Equity
$179,340
Purchase Details
Closed on
Feb 15, 2024
Sold by
Ahmad Qasir and Siddiqui Mortoza Kamal
Bought by
103 Home Llc
Home Financials for this Owner
Home Financials are based on the most recent Mortgage that was taken out on this home.
Original Mortgage
$300,000
Interest Rate
6.66%
Mortgage Type
Purchase Money Mortgage
Purchase Details
Closed on
Oct 10, 2019
Sold by
Angel Delvillar Esq
Bought by
Queensway Builders Llc
Home Financials for this Owner
Home Financials are based on the most recent Mortgage that was taken out on this home.
Original Mortgage
$720,000
Interest Rate
3.5%
Mortgage Type
New Conventional
Purchase Details
Closed on
Mar 31, 2006
Sold by
Burke A A and Burke N
Bought by
Jones George Robert
Home Financials for this Owner
Home Financials are based on the most recent Mortgage that was taken out on this home.
Original Mortgage
$340,000
Interest Rate
6.28%
Mortgage Type
Purchase Money Mortgage
Purchase Details
Closed on
Feb 6, 2002
Sold by
Burke Doris
Bought by
Wroblewski Cherly Lynn
Purchase Details
Closed on
Aug 2, 1999
Sold by
Castoria Frank and Debiase Dolores
Bought by
Burke James and Burke Doris
Home Financials for this Owner
Home Financials are based on the most recent Mortgage that was taken out on this home.
Original Mortgage
$243,000
Interest Rate
7.53%
Mortgage Type
Purchase Money Mortgage
Purchase Details
Closed on
Jun 6, 1998
Sold by
Castoria Frank and Debiase Dolores
Bought by
Castoria Frank and Debiase Dolores
Create a Home Valuation Report for This Property
The Home Valuation Report is an in-depth analysis detailing your home's value as well as a comparison with similar homes in the area
Home Values in the Area
Average Home Value in this Area
Purchase History
| Date | Buyer | Sale Price | Title Company |
|---|---|---|---|
| Cabrega Biag Ivan Gil | $1,160,000 | -- | |
| 103 Home Llc | $99,000 | -- | |
| 103 Home Llc | $99,000 | -- | |
| 103 Home Llc | $730,000 | -- | |
| Queensway Builders Llc | $665,000 | -- | |
| Queensway Builders Llc | $665,000 | -- | |
| Jones George Robert | $340,000 | -- | |
| Jones George Robert | $340,000 | -- | |
| Wroblewski Cherly Lynn | -- | -- | |
| Wroblewski Cherly Lynn | -- | -- | |
| Burke James | -- | First American Title Ins Co | |
| Burke James | -- | First American Title Ins Co | |
| Castoria Frank | -- | The Title Guarantee Company | |
| Castoria Frank | -- | The Title Guarantee Company |
Source: Public Records
Mortgage History
| Date | Status | Borrower | Loan Amount |
|---|---|---|---|
| Open | Cabrega Biag Ivan Gil | $986,000 | |
| Previous Owner | 103 Home Llc | $300,000 | |
| Previous Owner | 103 Home Llc | $0 | |
| Previous Owner | Queensway Builders Llc | $720,000 | |
| Previous Owner | Jones George Robert | $340,000 | |
| Previous Owner | Burke James | $243,000 |
Source: Public Records
Tax History Compared to Growth
Tax History
| Year | Tax Paid | Tax Assessment Tax Assessment Total Assessment is a certain percentage of the fair market value that is determined by local assessors to be the total taxable value of land and additions on the property. | Land | Improvement |
|---|---|---|---|---|
| 2025 | $6,563 | $33,535 | $8,486 | $25,049 |
| 2024 | $6,563 | $32,674 | $9,432 | $23,242 |
| 2023 | $6,217 | $30,954 | $7,888 | $23,066 |
| 2022 | $5,837 | $49,020 | $15,000 | $34,020 |
| 2021 | $5,881 | $48,300 | $15,000 | $33,300 |
| 2020 | $5,915 | $53,100 | $15,000 | $38,100 |
| 2019 | $5,696 | $54,420 | $15,000 | $39,420 |
| 2018 | $5,258 | $25,795 | $8,299 | $17,496 |
| 2017 | $4,967 | $24,364 | $9,077 | $15,287 |
| 2016 | $4,655 | $24,364 | $9,077 | $15,287 |
| 2015 | $2,772 | $23,288 | $9,929 | $13,359 |
| 2014 | $2,772 | $22,690 | $9,630 | $13,060 |
Source: Public Records
Map
Nearby Homes