Estimated Value: $197,215 - $290,000
2
Beds
2
Baths
1,755
Sq Ft
$140/Sq Ft
Est. Value
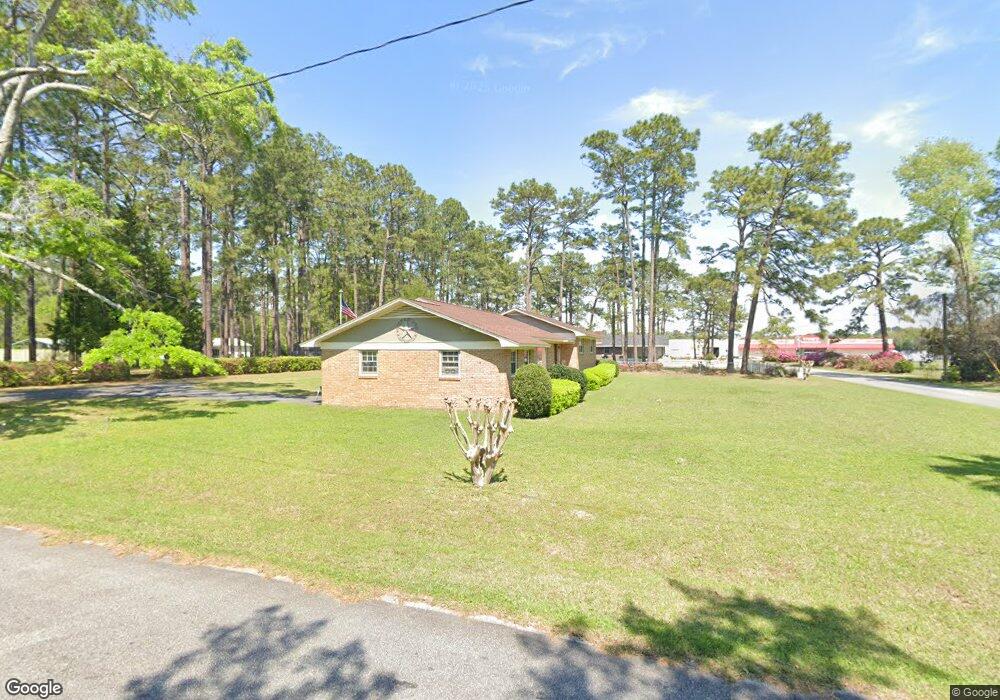
About This Home
This home is located at 79 27th St NE, Cairo, GA 39828 and is currently estimated at $246,054, approximately $140 per square foot. 79 27th St NE is a home located in Grady County with nearby schools including Cairo High School.
Ownership History
Date
Name
Owned For
Owner Type
Purchase Details
Closed on
Apr 14, 1978
Sold by
Collins Mildred M
Bought by
Ferrell Branklyn F and Ferrell Blevyn R
Current Estimated Value
Create a Home Valuation Report for This Property
The Home Valuation Report is an in-depth analysis detailing your home's value as well as a comparison with similar homes in the area
Purchase History
| Date | Buyer | Sale Price | Title Company |
|---|---|---|---|
| Ferrell Branklyn F | -- | -- |
Source: Public Records
Tax History
| Year | Tax Paid | Tax Assessment Tax Assessment Total Assessment is a certain percentage of the fair market value that is determined by local assessors to be the total taxable value of land and additions on the property. | Land | Improvement |
|---|---|---|---|---|
| 2024 | $2,062 | $74,072 | $4,312 | $69,760 |
| 2023 | $1,368 | $42,468 | $4,800 | $37,668 |
| 2022 | $1,432 | $42,468 | $4,800 | $37,668 |
| 2021 | $1,435 | $42,468 | $4,800 | $37,668 |
| 2020 | $1,438 | $42,468 | $4,800 | $37,668 |
| 2019 | $1,438 | $42,468 | $4,800 | $37,668 |
| 2018 | $1,364 | $42,468 | $4,800 | $37,668 |
| 2017 | $1,310 | $42,468 | $4,800 | $37,668 |
| 2016 | $1,101 | $35,877 | $4,800 | $31,077 |
| 2015 | $1,088 | $35,877 | $4,800 | $31,077 |
| 2014 | $1,087 | $35,877 | $4,800 | $31,077 |
| 2013 | -- | $32,635 | $4,800 | $27,835 |
Source: Public Records
Map
Nearby Homes
- 78.6 Ac Strickland Rd
- 2690 U S 84
- 21 24th St NE
- 66 22nd St NE
- 0 20th St NE
- 00 20th St NE
- 408 Bay Tree Rd NE
- 592 20th St SE
- 3109 U S 84
- 3109 U S 84
- 711 2nd Ave NE
- 00 State Route 188
- 0 State Route 188
- 00 Blackberry Ln
- 00 Meridian Rd
- Lot #15, 3 64 Acres Oakbend Cir
- 530 6th St
- 530 6th Ave SE
- 580 5th St SE
- 471 4th St SE
- 78 27th St NE
- 76 27th St NE
- 2630 Pineacre Dr NE
- 2690 Us Highway 84 E
- 78 26th St NE
- 85 28th St NE
- 74 27th St NE
- 77 28th St NE
- 2710 Us Highway 84 E
- 73 27th St NE
- 2575 Pineacre Dr NE
- 74 26th St NE
- 2600 Us Highway 84 E
- 2600 Us Highway 84 E
- 2600 U S 84
- 73 28th St NE
- 66 26th St NE
- 72 27th St NE
- 67 27th St NE
- 2570 Pineacre Dr NE
Your Personal Tour Guide
Ask me questions while you tour the home.