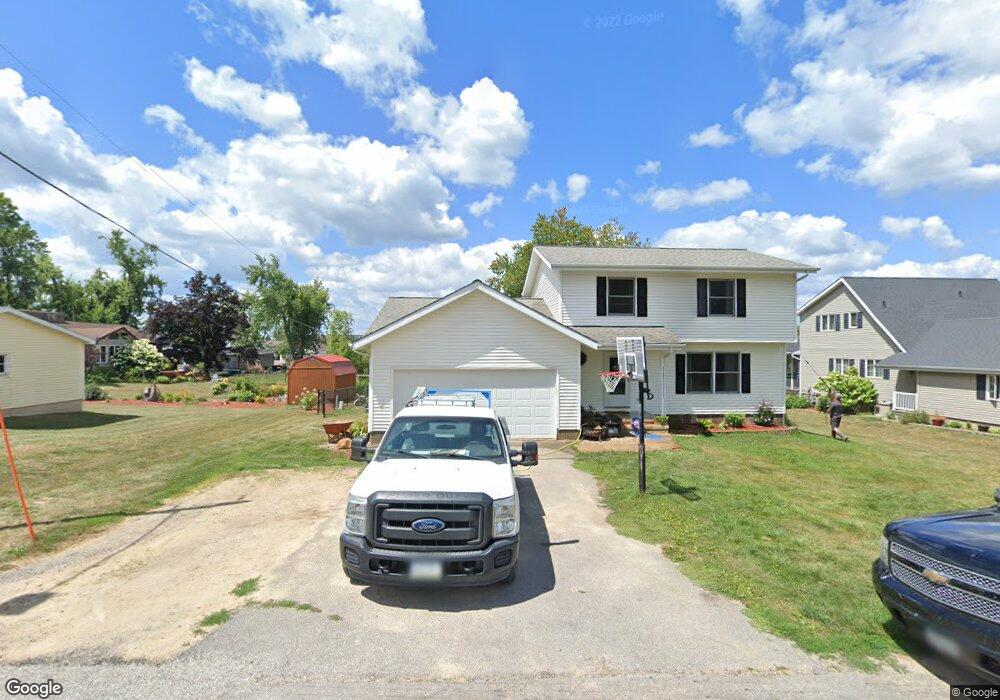
79 4th Ave Atkins, IA 52206
Estimated Value: $269,000 - $300,000
3
Beds
3
Baths
2,180
Sq Ft
$130/Sq Ft
Est. Value
About This Home
This home is located at 79 4th Ave, Atkins, IA 52206 and is currently estimated at $283,753, approximately $130 per square foot. 79 4th Ave is a home located in Benton County with nearby schools including Benton Community Senior High School.
Ownership History
Date
Name
Owned For
Owner Type
Purchase Details
Closed on
Sep 30, 2016
Sold by
Carley Denise R and Block Denise R
Bought by
Montague Nathan L and Montague Lindsay J
Current Estimated Value
Purchase Details
Closed on
Aug 28, 2008
Sold by
Pithan Matthew D and Pithan Elizabeth S
Bought by
Block Timothy A and Block Denise R
Home Financials for this Owner
Home Financials are based on the most recent Mortgage that was taken out on this home.
Original Mortgage
$127,200
Interest Rate
6.31%
Mortgage Type
Future Advance Clause Open End Mortgage
Create a Home Valuation Report for This Property
The Home Valuation Report is an in-depth analysis detailing your home's value as well as a comparison with similar homes in the area
Home Values in the Area
Average Home Value in this Area
Purchase History
| Date | Buyer | Sale Price | Title Company |
|---|---|---|---|
| Montague Nathan L | -- | None Available | |
| Block Timothy A | $156,500 | None Available |
Source: Public Records
Mortgage History
| Date | Status | Borrower | Loan Amount |
|---|---|---|---|
| Previous Owner | Block Timothy A | $127,200 |
Source: Public Records
Tax History Compared to Growth
Tax History
| Year | Tax Paid | Tax Assessment Tax Assessment Total Assessment is a certain percentage of the fair market value that is determined by local assessors to be the total taxable value of land and additions on the property. | Land | Improvement |
|---|---|---|---|---|
| 2025 | $3,324 | $250,700 | $34,800 | $215,900 |
| 2024 | $3,324 | $224,700 | $33,900 | $190,800 |
| 2023 | $2,982 | $224,700 | $33,900 | $190,800 |
| 2022 | $2,958 | $181,600 | $27,100 | $154,500 |
| 2021 | $2,958 | $181,600 | $27,100 | $154,500 |
| 2020 | $2,224 | $150,800 | $22,600 | $128,200 |
| 2019 | $2,392 | $150,800 | $22,600 | $128,200 |
| 2018 | $2,350 | $161,100 | $19,500 | $141,600 |
| 2017 | $2,222 | $161,100 | $19,500 | $141,600 |
| 2016 | $2,200 | $149,200 | $18,100 | $131,100 |
| 2015 | $2,200 | $149,200 | $18,100 | $131,100 |
| 2014 | $2,046 | $138,400 | $0 | $0 |
Source: Public Records
Map
Nearby Homes