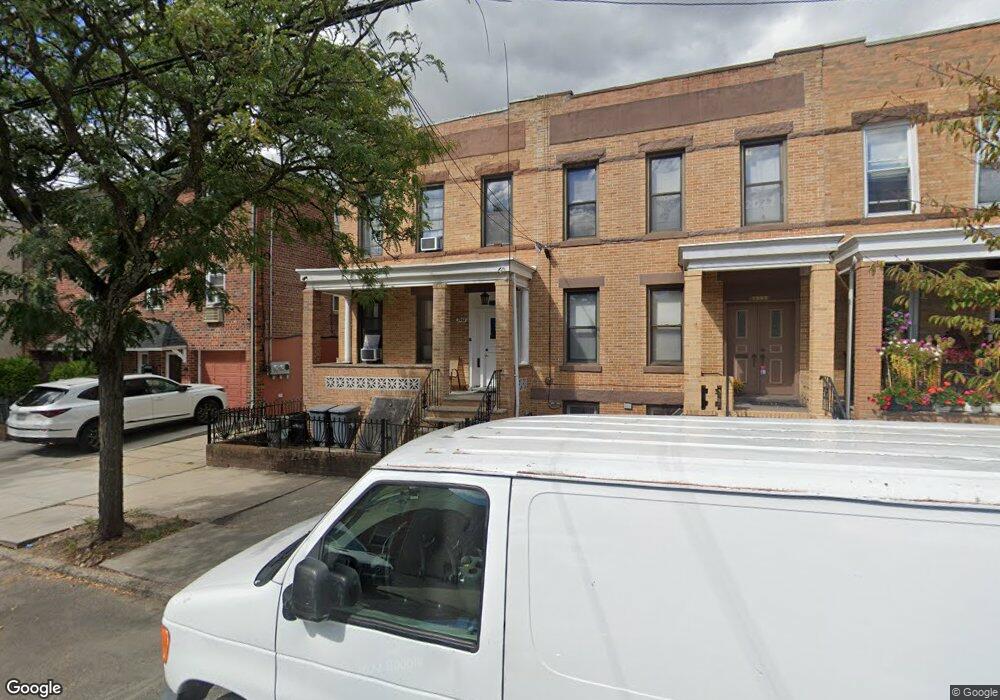
79-67 78th Ave Unit 2nd Fl Glendale, NY 11385
Glendale NeighborhoodEstimated Value: $818,761 - $929,000
2
Beds
1
Bath
1,800
Sq Ft
$495/Sq Ft
Est. Value
About This Home
This home is located at 79-67 78th Ave Unit 2nd Fl, Glendale, NY 11385 and is currently estimated at $890,690, approximately $494 per square foot. 79-67 78th Ave Unit 2nd Fl is a home located in Queens County with nearby schools including I.S. 119 the Glendale and Elm Community Charter School.
Ownership History
Date
Name
Owned For
Owner Type
Purchase Details
Closed on
Feb 14, 2007
Sold by
Miehl Gertrude and Schumeg Frank Joseph
Bought by
Tran Ky Trong and Tran Ninh Trong
Current Estimated Value
Home Financials for this Owner
Home Financials are based on the most recent Mortgage that was taken out on this home.
Original Mortgage
$40,000
Outstanding Balance
$24,225
Interest Rate
6.27%
Estimated Equity
$866,465
Purchase Details
Closed on
Sep 26, 2003
Sold by
Estate Of Stefanie Sumeg and Miehl
Bought by
Miehl Gertrude and Schumeg Frank J
Home Financials for this Owner
Home Financials are based on the most recent Mortgage that was taken out on this home.
Original Mortgage
$170,000
Interest Rate
5.67%
Mortgage Type
Purchase Money Mortgage
Create a Home Valuation Report for This Property
The Home Valuation Report is an in-depth analysis detailing your home's value as well as a comparison with similar homes in the area
Home Values in the Area
Average Home Value in this Area
Purchase History
| Date | Buyer | Sale Price | Title Company |
|---|---|---|---|
| Tran Ky Trong | $530,000 | -- | |
| Tran Ky Trong | $530,000 | -- | |
| Miehl Gertrude | -- | -- | |
| Miehl Gertrude | -- | -- |
Source: Public Records
Mortgage History
| Date | Status | Borrower | Loan Amount |
|---|---|---|---|
| Open | Tran Ky Trong | $40,000 | |
| Closed | Tran Ky Trong | $40,000 | |
| Open | Tran Ky Trong | $424,000 | |
| Closed | Tran Ky Trong | $424,000 | |
| Previous Owner | Miehl Gertrude | $170,000 |
Source: Public Records
Tax History Compared to Growth
Tax History
| Year | Tax Paid | Tax Assessment Tax Assessment Total Assessment is a certain percentage of the fair market value that is determined by local assessors to be the total taxable value of land and additions on the property. | Land | Improvement |
|---|---|---|---|---|
| 2025 | $6,908 | $36,437 | $9,843 | $26,594 |
| 2024 | $6,908 | $34,396 | $9,865 | $24,531 |
| 2023 | $6,563 | $32,674 | $8,965 | $23,709 |
| 2022 | $6,179 | $46,440 | $13,680 | $32,760 |
| 2021 | $6,514 | $49,680 | $13,680 | $36,000 |
| 2020 | $6,427 | $46,620 | $13,680 | $32,940 |
| 2019 | $5,996 | $39,900 | $13,680 | $26,220 |
| 2018 | $5,550 | $27,228 | $9,089 | $18,139 |
| 2017 | $5,258 | $25,795 | $9,951 | $15,844 |
| 2016 | $5,157 | $25,795 | $9,951 | $15,844 |
| 2015 | $2,935 | $25,303 | $12,406 | $12,897 |
| 2014 | $2,935 | $23,886 | $13,829 | $10,057 |
Source: Public Records
Map
Nearby Homes
- 79-67 78th Ave
- 7967 78th Ave
- 7969 78th Ave
- 7963 78th Ave
- 79-71 78th Ave Unit 2
- 79-71 78th Ave
- 7971 78th Ave
- 7961 78th Ave
- 7973 78th Ave
- 7959 78th Ave
- 7975 78th Ave Unit 2
- 7975 78th Ave
- 79-57 78th Ave Unit 2
- 79-57 78th Ave
- 7957 78th Ave
- 7977 78th Ave
- 7966 77th Rd
- 79-79 78th Ave Unit 2
- 79-79 78th Ave Unit 1
- 79-79 78th Ave