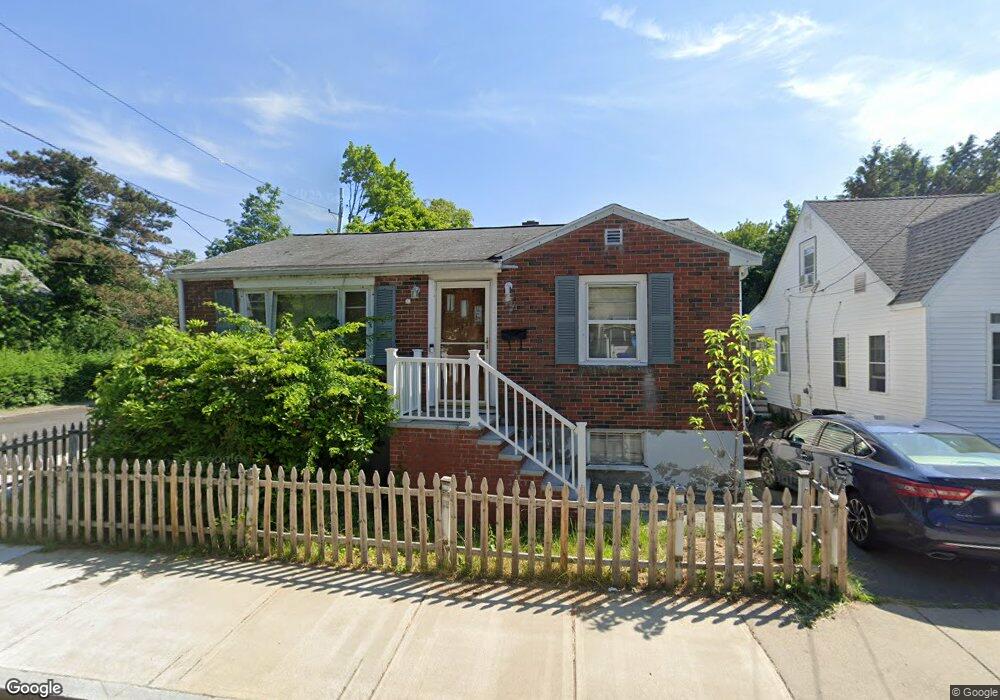
79 Bowman St Malden, MA 02148
Maplewood NeighborhoodEstimated Value: $479,000 - $537,741
1
Bed
1
Bath
832
Sq Ft
$610/Sq Ft
Est. Value
About This Home
This home is located at 79 Bowman St, Malden, MA 02148 and is currently estimated at $507,685, approximately $610 per square foot. 79 Bowman St is a home located in Middlesex County with nearby schools including Malden High School and Malden Catholic.
Ownership History
Date
Name
Owned For
Owner Type
Purchase Details
Closed on
Jan 9, 2007
Sold by
Mil Rt and Lomasney Ida R
Bought by
79 Bowman Street Rt and Lomasney Ida R
Current Estimated Value
Purchase Details
Closed on
Aug 8, 2000
Sold by
Delgreco Cidalia M
Bought by
Mil Rt and Lomasney Maurice
Purchase Details
Closed on
Sep 16, 1996
Sold by
Anzalone Anthony J and Gagliardi Marie
Bought by
Delgreco Robert J and Freitas Cidalia M
Home Financials for this Owner
Home Financials are based on the most recent Mortgage that was taken out on this home.
Original Mortgage
$87,840
Interest Rate
8.18%
Mortgage Type
Purchase Money Mortgage
Create a Home Valuation Report for This Property
The Home Valuation Report is an in-depth analysis detailing your home's value as well as a comparison with similar homes in the area
Home Values in the Area
Average Home Value in this Area
Purchase History
| Date | Buyer | Sale Price | Title Company |
|---|---|---|---|
| 79 Bowman Street Rt | -- | -- | |
| Mil Rt | $168,000 | -- | |
| Delgreco Robert J | $109,800 | -- | |
| Delgreco Robert J | $109,800 | -- |
Source: Public Records
Mortgage History
| Date | Status | Borrower | Loan Amount |
|---|---|---|---|
| Previous Owner | Delgreco Robert J | $115,000 | |
| Previous Owner | Delgreco Robert J | $87,840 |
Source: Public Records
Tax History Compared to Growth
Tax History
| Year | Tax Paid | Tax Assessment Tax Assessment Total Assessment is a certain percentage of the fair market value that is determined by local assessors to be the total taxable value of land and additions on the property. | Land | Improvement |
|---|---|---|---|---|
| 2025 | $50 | $444,300 | $230,600 | $213,700 |
| 2024 | $4,781 | $409,000 | $217,000 | $192,000 |
| 2023 | $4,599 | $377,300 | $196,700 | $180,600 |
| 2022 | $4,387 | $355,200 | $179,700 | $175,500 |
| 2021 | $4,161 | $338,600 | $169,600 | $169,000 |
| 2020 | $4,115 | $325,300 | $156,700 | $168,600 |
| 2019 | $3,937 | $296,700 | $149,200 | $147,500 |
| 2018 | $3,752 | $266,300 | $123,800 | $142,500 |
| 2017 | $3,773 | $266,300 | $123,800 | $142,500 |
| 2016 | $3,581 | $236,200 | $113,600 | $122,600 |
| 2015 | $3,494 | $222,100 | $108,200 | $113,900 |
| 2014 | $3,416 | $212,200 | $98,300 | $113,900 |
Source: Public Records
Map
Nearby Homes