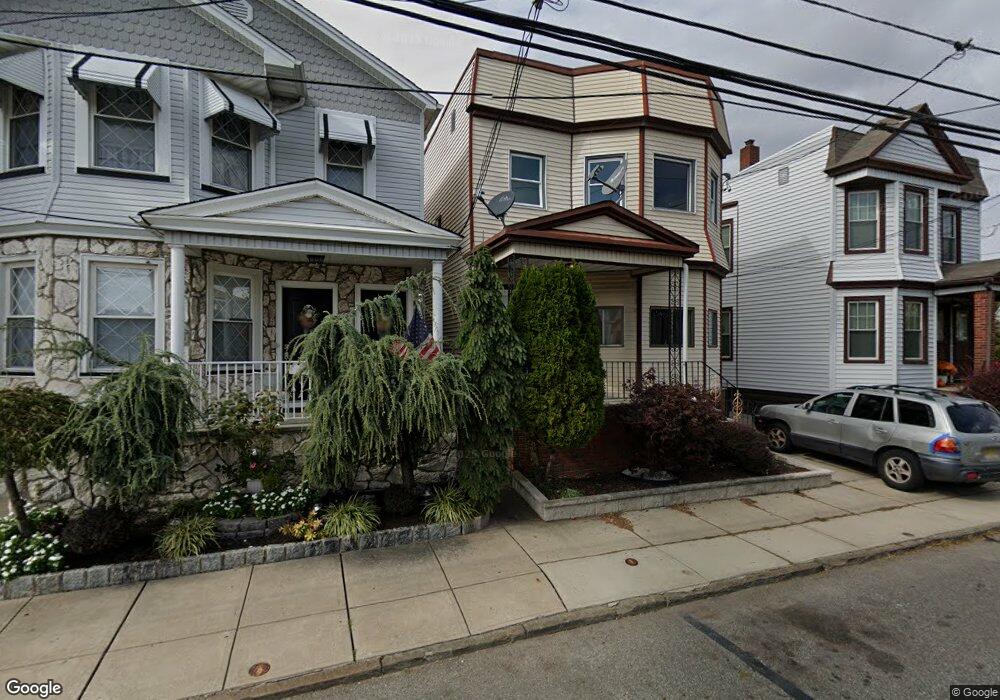
79 Brighton Ave Unit 2 Kearny, NJ 07032
Manor Section NeighborhoodEstimated Value: $481,694 - $708,000
4
Beds
2
Baths
2,036
Sq Ft
$300/Sq Ft
Est. Value
About This Home
This home is located at 79 Brighton Ave Unit 2, Kearny, NJ 07032 and is currently estimated at $611,424, approximately $300 per square foot. 79 Brighton Ave Unit 2 is a home located in Hudson County with nearby schools including Kearny High School and Kearny Christian Academy.
Ownership History
Date
Name
Owned For
Owner Type
Purchase Details
Closed on
Nov 4, 2024
Sold by
Velasquez Yamile and Velasquez Orlando
Bought by
Velasquez Mike and Velasquez Ashley
Current Estimated Value
Purchase Details
Closed on
Mar 10, 2020
Sold by
Gonzalez Rutilio
Bought by
Velasquez Yamile and Velasquez Orlando
Home Financials for this Owner
Home Financials are based on the most recent Mortgage that was taken out on this home.
Original Mortgage
$337,500
Interest Rate
3.3%
Mortgage Type
New Conventional
Purchase Details
Closed on
Mar 20, 2015
Sold by
Amaral Vitone Maria M
Bought by
Gonzalez Rutilio
Home Financials for this Owner
Home Financials are based on the most recent Mortgage that was taken out on this home.
Original Mortgage
$306,348
Interest Rate
3.87%
Mortgage Type
FHA
Create a Home Valuation Report for This Property
The Home Valuation Report is an in-depth analysis detailing your home's value as well as a comparison with similar homes in the area
Home Values in the Area
Average Home Value in this Area
Purchase History
| Date | Buyer | Sale Price | Title Company |
|---|---|---|---|
| Velasquez Mike | -- | None Listed On Document | |
| Velasquez Mike | -- | None Listed On Document | |
| Velasquez Mike | -- | None Listed On Document | |
| Velasquez Yamile | $450,000 | Stewart Title Guaranty Co | |
| Gonzalez Rutilio | $312,000 | Multiple |
Source: Public Records
Mortgage History
| Date | Status | Borrower | Loan Amount |
|---|---|---|---|
| Previous Owner | Velasquez Yamile | $337,500 | |
| Previous Owner | Gonzalez Rutilio | $306,348 |
Source: Public Records
Tax History Compared to Growth
Tax History
| Year | Tax Paid | Tax Assessment Tax Assessment Total Assessment is a certain percentage of the fair market value that is determined by local assessors to be the total taxable value of land and additions on the property. | Land | Improvement |
|---|---|---|---|---|
| 2025 | $11,658 | $108,900 | $20,600 | $88,300 |
| 2024 | $11,507 | $108,900 | $20,600 | $88,300 |
| 2023 | $11,507 | $108,900 | $20,600 | $88,300 |
| 2022 | $11,480 | $108,900 | $20,600 | $88,300 |
| 2021 | $11,418 | $108,900 | $20,600 | $88,300 |
| 2020 | $9,294 | $88,600 | $20,600 | $68,000 |
| 2019 | $9,340 | $88,600 | $20,600 | $68,000 |
| 2018 | $9,357 | $88,600 | $20,600 | $68,000 |
| 2017 | $9,485 | $88,600 | $20,600 | $68,000 |
| 2016 | $9,453 | $88,600 | $20,600 | $68,000 |
| 2015 | $9,149 | $73,800 | $20,600 | $53,200 |
| 2014 | $7,407 | $73,800 | $20,600 | $53,200 |
Source: Public Records
Map
Nearby Homes
- 79 Brighton Ave
- 81 Brighton Ave
- 77 Brighton Ave
- 73 Brighton Ave
- 280 Belgrove Dr
- 274 Belgrove Dr
- 87 Bergen Ave
- 89 Bergen Ave
- 82 Brighton Ave Unit 2
- 82 Brighton Ave
- 74 Brighton Ave Unit 76
- 270 Belgrove Dr
- 80 Brighton Ave
- 78 Brighton Ave
- 78 Brighton Ave Unit 2
- 78 Brighton Ave Unit 1
- 84 Brighton Ave
- 81 Bergen Ave
- 91 Bergen Ave
- 86 Brighton Ave