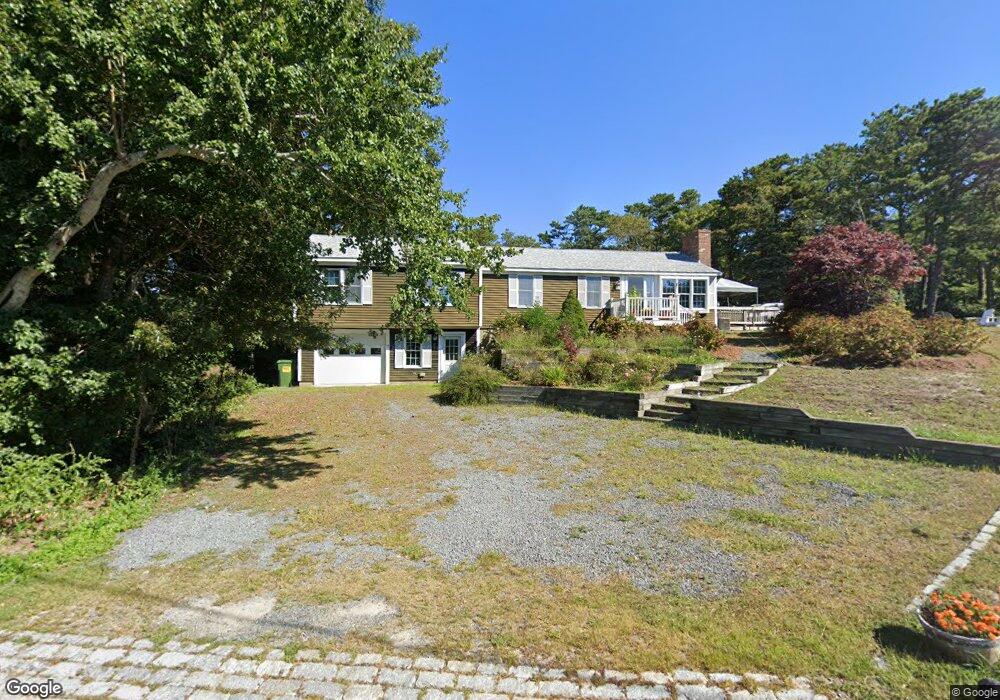
79 Cranview Rd Brewster, MA 02631
Estimated Value: $461,000 - $830,000
3
Beds
2
Baths
1,488
Sq Ft
$471/Sq Ft
Est. Value
About This Home
This home is located at 79 Cranview Rd, Brewster, MA 02631 and is currently estimated at $700,759, approximately $470 per square foot. 79 Cranview Rd is a home located in Barnstable County with nearby schools including Stony Brook Elementary School, Eddy Elementary School, and Nauset Regional Middle School.
Ownership History
Date
Name
Owned For
Owner Type
Purchase Details
Closed on
Aug 18, 2022
Sold by
Archambault Kenneth W and Archambault Patricia R
Bought by
Archambault Ft
Current Estimated Value
Purchase Details
Closed on
May 24, 2021
Sold by
Archambault Kenneth W and Archambault Patricia R
Bought by
Archambault Ft
Purchase Details
Closed on
Oct 1, 1982
Bought by
Archambault Kenneth W and Archambault Patricia R
Create a Home Valuation Report for This Property
The Home Valuation Report is an in-depth analysis detailing your home's value as well as a comparison with similar homes in the area
Home Values in the Area
Average Home Value in this Area
Purchase History
| Date | Buyer | Sale Price | Title Company |
|---|---|---|---|
| Archambault Ft | -- | None Available | |
| Archambault Ft | -- | None Available | |
| Archambault Kenneth W | -- | -- |
Source: Public Records
Mortgage History
| Date | Status | Borrower | Loan Amount |
|---|---|---|---|
| Previous Owner | Archambault Kenneth W | $110,000 |
Source: Public Records
Tax History
| Year | Tax Paid | Tax Assessment Tax Assessment Total Assessment is a certain percentage of the fair market value that is determined by local assessors to be the total taxable value of land and additions on the property. | Land | Improvement |
|---|---|---|---|---|
| 2025 | $4,220 | $613,300 | $257,000 | $356,300 |
| 2024 | $3,979 | $584,300 | $242,400 | $341,900 |
| 2023 | $3,657 | $523,200 | $216,400 | $306,800 |
| 2022 | $3,473 | $442,400 | $180,300 | $262,100 |
| 2021 | $3,321 | $387,100 | $156,700 | $230,400 |
| 2020 | $3,275 | $379,900 | $156,700 | $223,200 |
| 2019 | $3,145 | $366,500 | $150,800 | $215,700 |
| 2018 | $2,999 | $363,100 | $150,800 | $212,300 |
| 2017 | $2,827 | $336,900 | $150,800 | $186,100 |
| 2016 | $2,806 | $332,800 | $147,800 | $185,000 |
| 2015 | $2,689 | $325,600 | $144,900 | $180,700 |
Source: Public Records
Map
Nearby Homes
- 360 Airline Rd
- 2 Beaver Dam Way
- 13 Rogers Rd
- 432 Old Chatham Rd Unit 403
- 83 Airline Rd
- 36 Island St
- 86 Greenland Cir
- 37 Cyprus Rd
- 37 Cyprus Rd
- 102 Wildwood Rd
- 20 Sycamore Ln
- 0 Canoe Pond Dr
- 120 Red Maple Rd
- 92 Azalea Dr
- 3 Bittersweet Ln
- 92 Whiffletree Ave
- 241 Old Bass River Rd
- 1 Norseman Dr
- 144 Forest Pines Dr
- 0 Ridgewood Dr
- 93 Cranview Rd
- 56 Cranview Rd
- 98 Cranview Rd
- 37 Cranview Rd
- 25 Black Duck Cartway
- 39 Black Duck Cartway
- 29 Cranview Rd
- 40 Cranview Rd
- 128 Cranview Rd
- 14 Cranview Rd
- 525 Slough Rd
- 501 Slough Rd
- 533 Slough Rd
- 18 Cranview Rd
- 489 Slough Rd
- 545 Slough Rd
- 12 Slough Rd
- 0 Slough Rd
- 528 Slough Rd
- 6 Glenwood Rd
Your Personal Tour Guide
Ask me questions while you tour the home.