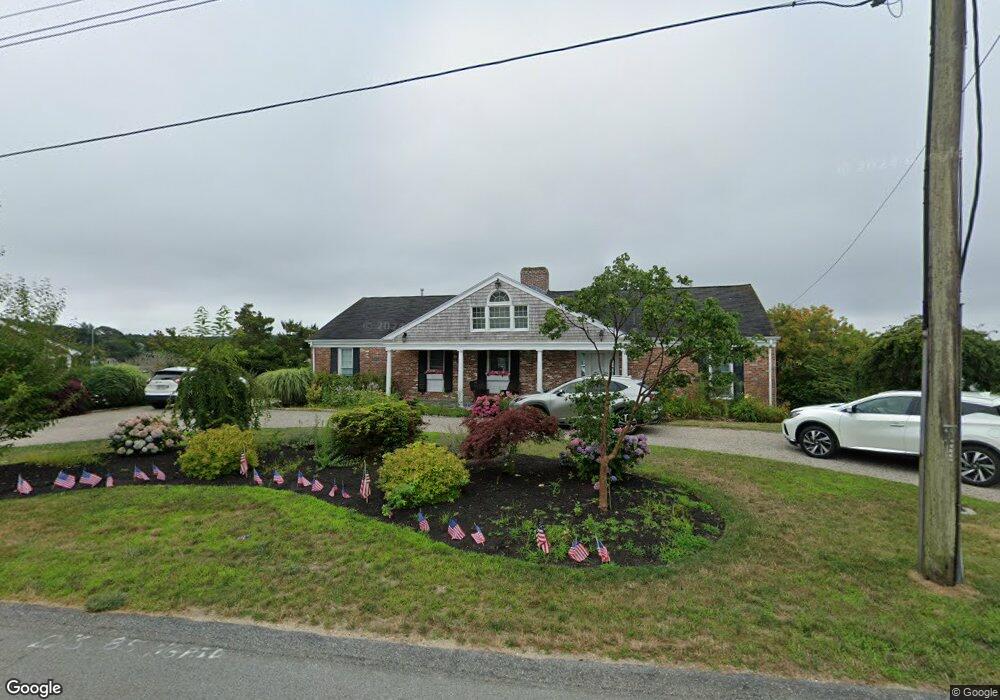
79 Elgin Rd Pocasset, MA 2559
Pocasset NeighborhoodEstimated Value: $1,410,000 - $2,459,000
4
Beds
4
Baths
2,112
Sq Ft
$960/Sq Ft
Est. Value
About This Home
This home is located at 79 Elgin Rd, Pocasset, MA 2559 and is currently estimated at $2,027,710, approximately $960 per square foot. 79 Elgin Rd is a home located in Barnstable County with nearby schools including Bourne High School, Cadence Academy Preschool - Bourne, and Heritage Christian Academy.
Ownership History
Date
Name
Owned For
Owner Type
Purchase Details
Closed on
Feb 16, 2018
Sold by
Lowney Charles W
Bought by
Charles W Lowney Ret and Lowney
Current Estimated Value
Purchase Details
Closed on
Jun 28, 2002
Sold by
Schlener Susan
Bought by
Lowney Charles W and Lowney Irene
Home Financials for this Owner
Home Financials are based on the most recent Mortgage that was taken out on this home.
Original Mortgage
$682,500
Interest Rate
6.92%
Mortgage Type
Purchase Money Mortgage
Purchase Details
Closed on
Nov 18, 1996
Sold by
Nassif David E and Nassif Diane R
Bought by
Schlener Susan
Home Financials for this Owner
Home Financials are based on the most recent Mortgage that was taken out on this home.
Original Mortgage
$90,000
Interest Rate
7.99%
Mortgage Type
Purchase Money Mortgage
Create a Home Valuation Report for This Property
The Home Valuation Report is an in-depth analysis detailing your home's value as well as a comparison with similar homes in the area
Home Values in the Area
Average Home Value in this Area
Purchase History
| Date | Buyer | Sale Price | Title Company |
|---|---|---|---|
| Charles W Lowney Ret | -- | -- | |
| Charles W Lowney Ret | -- | -- | |
| Lowney Charles W | $1,020,000 | -- | |
| Lowney Charles W | $1,020,000 | -- | |
| Schlener Susan | $435,000 | -- | |
| Schlener Susan | $435,000 | -- |
Source: Public Records
Mortgage History
| Date | Status | Borrower | Loan Amount |
|---|---|---|---|
| Previous Owner | Schlener Susan | $840,000 | |
| Previous Owner | Schlener Susan | $682,500 | |
| Previous Owner | Schlener Susan | $90,000 |
Source: Public Records
Tax History Compared to Growth
Tax History
| Year | Tax Paid | Tax Assessment Tax Assessment Total Assessment is a certain percentage of the fair market value that is determined by local assessors to be the total taxable value of land and additions on the property. | Land | Improvement |
|---|---|---|---|---|
| 2025 | $17,691 | $2,265,200 | $1,764,800 | $500,400 |
| 2024 | $17,300 | $2,157,100 | $1,680,700 | $476,400 |
| 2023 | $16,828 | $1,910,100 | $1,487,500 | $422,600 |
| 2022 | $16,677 | $1,652,800 | $1,316,300 | $336,500 |
| 2021 | $16,207 | $1,504,800 | $1,198,000 | $306,800 |
| 2020 | $15,911 | $1,481,500 | $1,186,500 | $295,000 |
| 2019 | $15,400 | $1,465,300 | $1,186,500 | $278,800 |
| 2018 | $12,231 | $1,160,400 | $904,200 | $256,200 |
| 2017 | $11,547 | $1,121,100 | $895,600 | $225,500 |
| 2016 | $11,346 | $1,116,700 | $895,600 | $221,100 |
| 2015 | $11,245 | $1,116,700 | $895,600 | $221,100 |
Source: Public Records
Map
Nearby Homes
- 22 Nairn Rd
- 48 Red Brook Harbor Rd
- 3 Red Brook Pond Dr
- 1094 County Rd
- 171 Bellavista Dr
- 75 Winsor Rd
- 10 Squeteague Harbor Rd
- 940 County Rd
- 34 Kenwood Rd
- 45 Kenwood Rd
- 250 Scraggy Neck Rd
- 1234 Route 28a
- 1234 Route 28a
- 89 Harbor Dr
- 254 Barlows Landing Rd
- 70 Wings Neck Rd
- 24 Richmond Rd
- 940 County Rd
- 709 County Rd
- 7 4th Ave