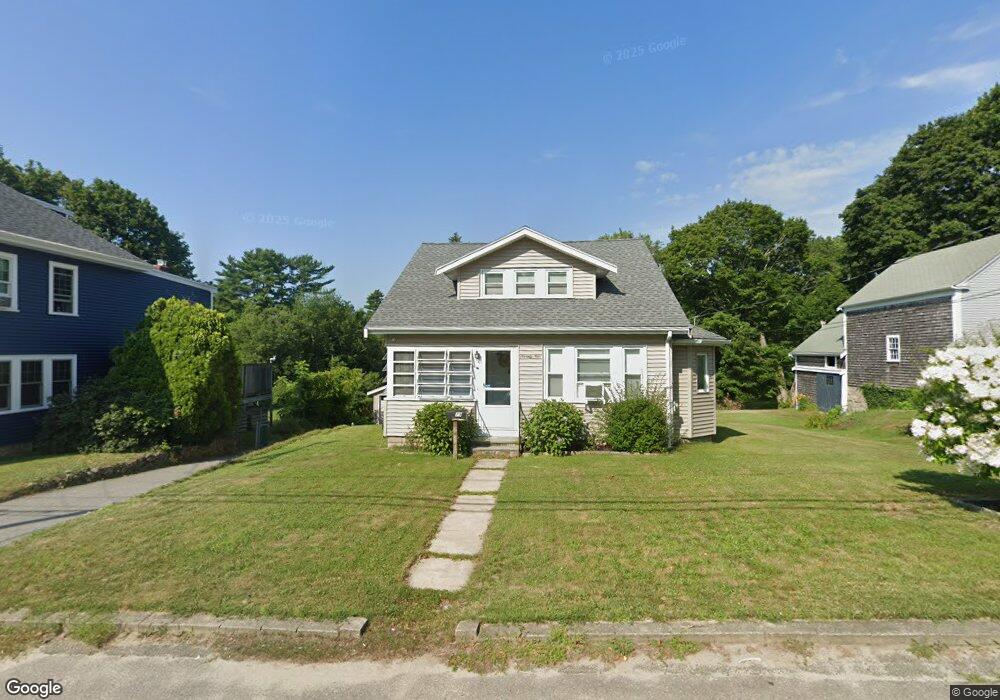
79 Gibbs Ave Wareham, MA 02571
Wareham Center NeighborhoodEstimated Value: $452,000 - $505,000
3
Beds
2
Baths
1,282
Sq Ft
$373/Sq Ft
Est. Value
About This Home
This home is located at 79 Gibbs Ave, Wareham, MA 02571 and is currently estimated at $478,782, approximately $373 per square foot. 79 Gibbs Ave is a home located in Plymouth County with nearby schools including Tabor Academy.
Ownership History
Date
Name
Owned For
Owner Type
Purchase Details
Closed on
Jun 4, 2010
Sold by
Corcoran Maryjo
Bought by
Lembo Laura J
Current Estimated Value
Home Financials for this Owner
Home Financials are based on the most recent Mortgage that was taken out on this home.
Original Mortgage
$227,000
Outstanding Balance
$152,086
Interest Rate
5.12%
Mortgage Type
Purchase Money Mortgage
Estimated Equity
$326,696
Create a Home Valuation Report for This Property
The Home Valuation Report is an in-depth analysis detailing your home's value as well as a comparison with similar homes in the area
Home Values in the Area
Average Home Value in this Area
Purchase History
| Date | Buyer | Sale Price | Title Company |
|---|---|---|---|
| Lembo Laura J | $228,000 | -- | |
| Lembo Laura J | $228,000 | -- |
Source: Public Records
Mortgage History
| Date | Status | Borrower | Loan Amount |
|---|---|---|---|
| Open | Lembo Laura J | $227,000 | |
| Closed | Lembo Laura J | $227,000 |
Source: Public Records
Tax History
| Year | Tax Paid | Tax Assessment Tax Assessment Total Assessment is a certain percentage of the fair market value that is determined by local assessors to be the total taxable value of land and additions on the property. | Land | Improvement |
|---|---|---|---|---|
| 2025 | $3,805 | $365,200 | $112,600 | $252,600 |
| 2024 | $3,893 | $346,700 | $87,300 | $259,400 |
| 2023 | $3,801 | $316,000 | $79,400 | $236,600 |
| 2022 | $3,490 | $264,800 | $79,400 | $185,400 |
| 2021 | $3,219 | $239,300 | $79,400 | $159,900 |
| 2020 | $3,084 | $232,600 | $79,400 | $153,200 |
| 2019 | $2,945 | $221,600 | $74,600 | $147,000 |
| 2018 | $2,727 | $200,100 | $74,600 | $125,500 |
| 2017 | $2,691 | $200,100 | $74,600 | $125,500 |
| 2016 | $2,484 | $183,600 | $71,500 | $112,100 |
| 2015 | $2,366 | $181,000 | $71,500 | $109,500 |
| 2014 | $2,449 | $190,600 | $71,500 | $119,100 |
Source: Public Records
Map
Nearby Homes
- 437 Main St
- 10 Longmeadow Dr
- 6 Bourne Terrace
- 110 Mayflower Ridge Dr
- 233 Marion Rd
- 7 Maud Palmer Dr
- 2645 Cranberry Hwy Unit A
- 12 Oakdale St
- 15 14th Ave
- 9 Woodville Way
- 1 Nimrod Way
- 15 Broadmarsh Ave
- 19 Station St
- 17 Station St
- 6 Allen Ave
- 20 Grant St
- 10 Oak St
- 43 Shore Ave
- 2697 Cranberry Hwy Unit 21
- 6 Wildwood Ave
Your Personal Tour Guide
Ask me questions while you tour the home.