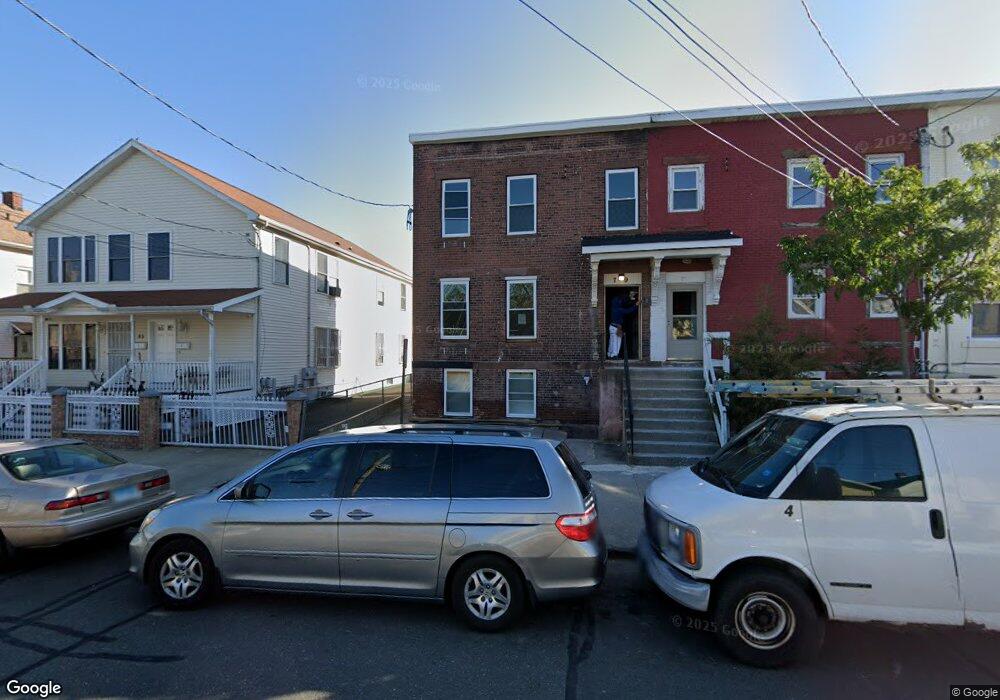
79 Haven St New Haven, CT 06513
Fair Haven NeighborhoodEstimated Value: $242,000 - $407,000
3
Beds
2
Baths
1,232
Sq Ft
$257/Sq Ft
Est. Value
About This Home
This home is located at 79 Haven St, New Haven, CT 06513 and is currently estimated at $317,036, approximately $257 per square foot. 79 Haven St is a home located in New Haven County with nearby schools including Elm City College Preparatory School, Cold Spring School, and St Francis & St Rose Of Lima School.
Ownership History
Date
Name
Owned For
Owner Type
Purchase Details
Closed on
May 26, 2021
Sold by
Reichman Brodie Re Llc
Bought by
James P De2 Llc
Current Estimated Value
Purchase Details
Closed on
Jul 29, 2020
Sold by
Chugani Archana M
Bought by
Reichman Brodie Re Llc
Purchase Details
Closed on
Aug 5, 2005
Sold by
New Haven City Of
Bought by
Chugani Arehana M
Home Financials for this Owner
Home Financials are based on the most recent Mortgage that was taken out on this home.
Original Mortgage
$115,000
Interest Rate
5.84%
Purchase Details
Closed on
May 31, 1994
Sold by
Dime Sb Ny
Bought by
Fgb Rlty Advisors
Create a Home Valuation Report for This Property
The Home Valuation Report is an in-depth analysis detailing your home's value as well as a comparison with similar homes in the area
Home Values in the Area
Average Home Value in this Area
Purchase History
| Date | Buyer | Sale Price | Title Company |
|---|---|---|---|
| James P De2 Llc | -- | None Available | |
| Reichman Brodie Re Llc | $55,000 | None Available | |
| Chugani Arehana M | $8,000 | -- | |
| Fgb Rlty Advisors | $16,000 | -- |
Source: Public Records
Mortgage History
| Date | Status | Borrower | Loan Amount |
|---|---|---|---|
| Previous Owner | Fgb Rlty Advisors | $115,000 | |
| Previous Owner | Fgb Rlty Advisors | $34,000 |
Source: Public Records
Tax History Compared to Growth
Tax History
| Year | Tax Paid | Tax Assessment Tax Assessment Total Assessment is a certain percentage of the fair market value that is determined by local assessors to be the total taxable value of land and additions on the property. | Land | Improvement |
|---|---|---|---|---|
| 2025 | $4,532 | $115,030 | $23,660 | $91,370 |
| 2024 | $4,429 | $115,030 | $23,660 | $91,370 |
| 2023 | $4,279 | $115,030 | $23,660 | $91,370 |
| 2022 | $6,230 | $156,730 | $23,660 | $133,070 |
| 2021 | $3,962 | $90,300 | $18,900 | $71,400 |
| 2020 | $3,053 | $69,580 | $18,900 | $50,680 |
| 2019 | $2,991 | $69,580 | $18,900 | $50,680 |
| 2018 | $2,991 | $69,580 | $18,900 | $50,680 |
| 2017 | $2,691 | $69,580 | $18,900 | $50,680 |
| 2016 | $2,414 | $58,100 | $13,440 | $44,660 |
| 2015 | $2,414 | $58,100 | $13,440 | $44,660 |
| 2014 | $2,414 | $58,100 | $13,440 | $44,660 |
Source: Public Records
Map
Nearby Homes