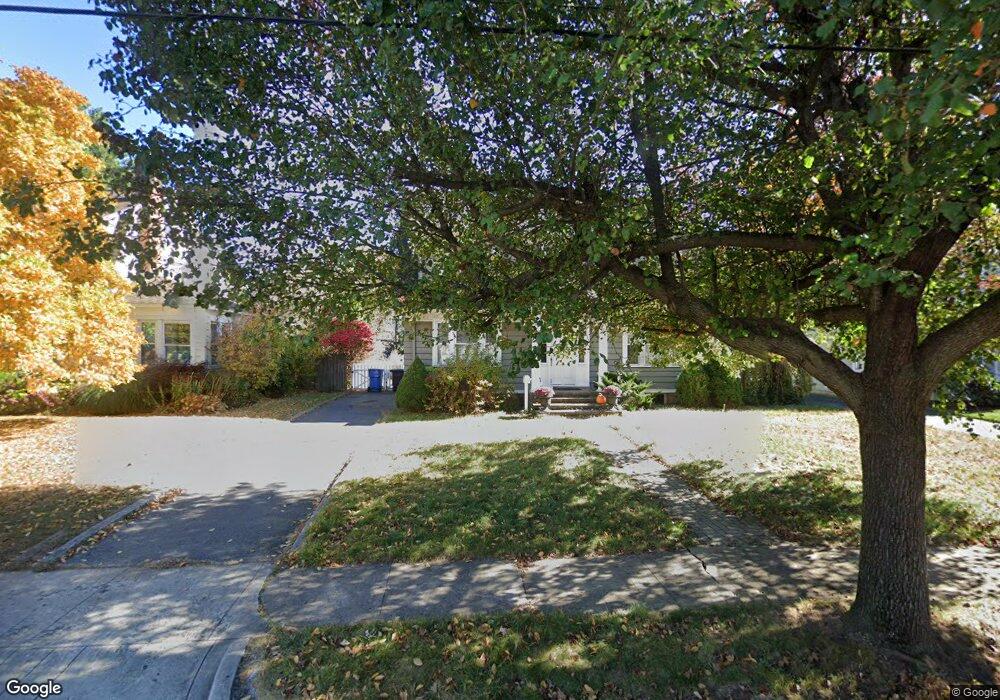
79 Hazelmere Rd New Britain, CT 06053
Estimated Value: $358,486 - $432,000
3
Beds
2
Baths
2,082
Sq Ft
$188/Sq Ft
Est. Value
About This Home
This home is located at 79 Hazelmere Rd, New Britain, CT 06053 and is currently estimated at $391,622, approximately $188 per square foot. 79 Hazelmere Rd is a home located in Hartford County with nearby schools including Holmes School, Pulaski Middle School, and Mountain Laurel Sudbury School.
Ownership History
Date
Name
Owned For
Owner Type
Purchase Details
Closed on
Apr 29, 2005
Sold by
Franklin 2Nd Robert E and Franklin Anne H
Bought by
Jackie Philip W
Current Estimated Value
Home Financials for this Owner
Home Financials are based on the most recent Mortgage that was taken out on this home.
Original Mortgage
$160,000
Outstanding Balance
$84,014
Interest Rate
5.95%
Estimated Equity
$307,608
Purchase Details
Closed on
Jun 25, 2001
Sold by
Soares William A
Bought by
Franklin Ii Robert E and Franklin Anne H
Home Financials for this Owner
Home Financials are based on the most recent Mortgage that was taken out on this home.
Original Mortgage
$187,418
Interest Rate
2.75%
Purchase Details
Closed on
Jun 9, 1994
Sold by
Gouthro Linda
Bought by
Soares William A
Create a Home Valuation Report for This Property
The Home Valuation Report is an in-depth analysis detailing your home's value as well as a comparison with similar homes in the area
Home Values in the Area
Average Home Value in this Area
Purchase History
| Date | Buyer | Sale Price | Title Company |
|---|---|---|---|
| Jackie Philip W | $220,000 | -- | |
| Franklin Ii Robert E | $188,900 | -- | |
| Soares William A | $50,000 | -- |
Source: Public Records
Mortgage History
| Date | Status | Borrower | Loan Amount |
|---|---|---|---|
| Open | Soares William A | $160,000 | |
| Previous Owner | Soares William A | $187,418 | |
| Previous Owner | Soares William A | $8,500 |
Source: Public Records
Tax History Compared to Growth
Tax History
| Year | Tax Paid | Tax Assessment Tax Assessment Total Assessment is a certain percentage of the fair market value that is determined by local assessors to be the total taxable value of land and additions on the property. | Land | Improvement |
|---|---|---|---|---|
| 2025 | $8,543 | $218,050 | $67,830 | $150,220 |
| 2024 | $8,633 | $218,050 | $67,830 | $150,220 |
| 2023 | $8,347 | $218,050 | $67,830 | $150,220 |
| 2022 | $7,477 | $151,060 | $31,290 | $119,770 |
| 2021 | $7,477 | $151,060 | $31,290 | $119,770 |
| 2020 | $7,629 | $151,060 | $31,290 | $119,770 |
| 2019 | $7,629 | $151,060 | $31,290 | $119,770 |
| 2018 | $7,629 | $151,060 | $31,290 | $119,770 |
| 2017 | $6,423 | $127,190 | $28,490 | $98,700 |
| 2016 | $6,423 | $127,190 | $28,490 | $98,700 |
| 2015 | $6,232 | $127,190 | $28,490 | $98,700 |
| 2014 | $6,232 | $127,190 | $28,490 | $98,700 |
Source: Public Records
Map
Nearby Homes
- 84 Barbour Rd
- 53 Park Dr
- 227 Amherst St
- 335 Commonwealth Ave
- 37 Recano Rd
- 34 Oneida St
- 258 Eddy Glover Blvd
- 1403 Stanley St
- 91 Brighton St
- 1259 East St Unit A
- 1251 East St Unit F
- 1243 East St Unit F
- 83 Kim Dr
- 34 Beacon St
- 426 Allen St
- 16 Vincent Ave
- 55 Alexander Rd
- 394 Mcclintock St
- 57 Merigold Dr
- 90 Country Club Rd
- 83 Hazelmere Rd
- 77 Hazelmere Rd
- 89 Hazelmere Rd
- 63 Hazelmere Rd
- 60 Sylvan Rd
- 66 Sylvan Rd
- 95 Hazelmere Rd
- 50 Sylvan Rd
- 78 Hazelmere Rd
- 84 Hazelmere Rd
- 66 Hazelmere Rd
- 74 Sylvan Rd
- 55 Hazelmere Rd
- 101 Hazelmere Rd
- 92 Hazelmere Rd
- 60 Hazelmere Rd
- 20 Sylvan Rd
- 80 Sylvan Rd
- 107 Hazelmere Rd
- 54 Hazelmere Rd