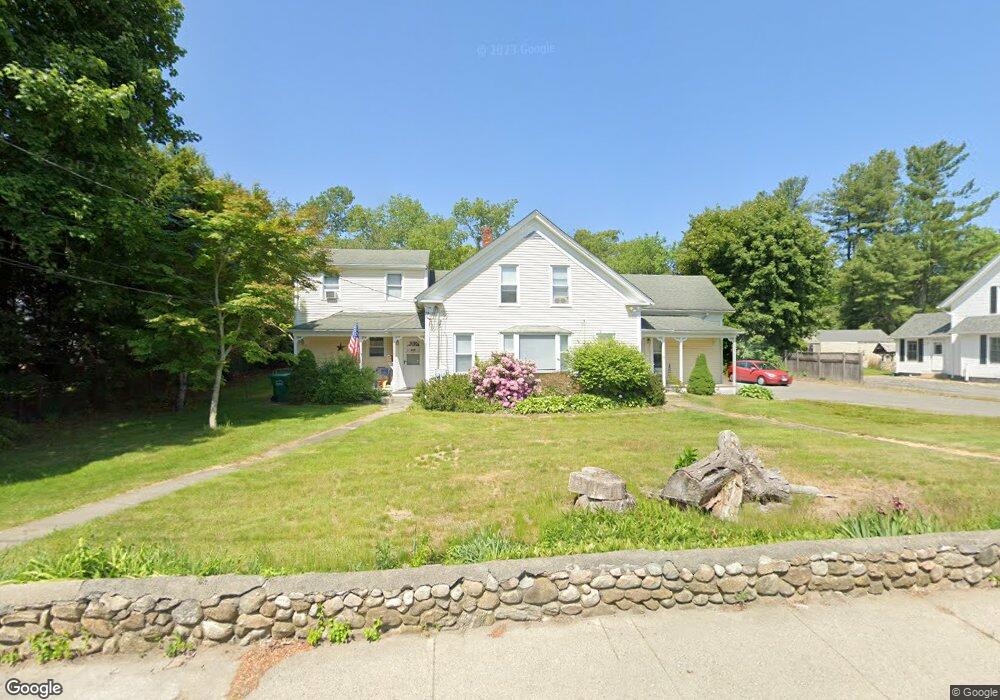
79 Hecla St Uxbridge, MA 01569
Estimated Value: $467,000 - $590,000
5
Beds
3
Baths
2,317
Sq Ft
$226/Sq Ft
Est. Value
About This Home
This home is located at 79 Hecla St, Uxbridge, MA 01569 and is currently estimated at $523,456, approximately $225 per square foot. 79 Hecla St is a home located in Worcester County with nearby schools including Uxbridge High School and Our Lady of the Valley Regional School.
Ownership History
Date
Name
Owned For
Owner Type
Purchase Details
Closed on
Apr 2, 2007
Sold by
Funnell Christine N and Funnell David M
Bought by
Kokennen Damian M and Kokennen Kimberly L
Current Estimated Value
Home Financials for this Owner
Home Financials are based on the most recent Mortgage that was taken out on this home.
Original Mortgage
$246,400
Outstanding Balance
$150,449
Interest Rate
6.33%
Mortgage Type
Purchase Money Mortgage
Estimated Equity
$373,007
Purchase Details
Closed on
Jul 28, 1995
Sold by
Fgb Realty Advisors
Bought by
Funnell David M and Funnell Christine
Purchase Details
Closed on
Aug 18, 1994
Sold by
Chamberlain Thomas
Bought by
Fgb Realty Advisors
Create a Home Valuation Report for This Property
The Home Valuation Report is an in-depth analysis detailing your home's value as well as a comparison with similar homes in the area
Home Values in the Area
Average Home Value in this Area
Purchase History
| Date | Buyer | Sale Price | Title Company |
|---|---|---|---|
| Kokennen Damian M | $308,000 | -- | |
| Funnell David M | $64,900 | -- | |
| Fgb Realty Advisors | $72,000 | -- |
Source: Public Records
Mortgage History
| Date | Status | Borrower | Loan Amount |
|---|---|---|---|
| Open | Kokennen Damian M | $246,400 | |
| Previous Owner | Fgb Realty Advisors | $35,000 | |
| Previous Owner | Fgb Realty Advisors | $130,000 | |
| Previous Owner | Fgb Realty Advisors | $30,000 |
Source: Public Records
Tax History
| Year | Tax Paid | Tax Assessment Tax Assessment Total Assessment is a certain percentage of the fair market value that is determined by local assessors to be the total taxable value of land and additions on the property. | Land | Improvement |
|---|---|---|---|---|
| 2025 | $52 | $396,400 | $133,900 | $262,500 |
| 2024 | $4,977 | $385,200 | $122,700 | $262,500 |
| 2023 | $4,714 | $337,900 | $111,600 | $226,300 |
| 2022 | $4,399 | $290,200 | $101,200 | $189,000 |
| 2021 | $4,297 | $271,600 | $96,700 | $174,900 |
| 2020 | $4,528 | $270,500 | $99,800 | $170,700 |
| 2019 | $4,499 | $259,300 | $92,400 | $166,900 |
| 2018 | $4,061 | $236,500 | $92,400 | $144,100 |
| 2017 | $4,164 | $245,500 | $86,300 | $159,200 |
| 2016 | $4,048 | $230,400 | $84,700 | $145,700 |
| 2015 | $3,905 | $224,400 | $84,700 | $139,700 |
Source: Public Records
Map
Nearby Homes
- 223 Mendon St
- 107 Henry St
- 76 Pouts Ln
- 44 Pouts Ln
- 35 Pouts Ln
- 16 Farnum St
- 79 High St
- 95 High St Unit C
- 5 Peter St Unit D
- 12 Meadow Rd
- 24 Kettle Hill Rd
- 117 Quaker Hwy Unit 29
- 53 Asylum St
- 13A Asylum St
- 40 Emilia Dr
- 218 E Hartford Ave Unit 218
- 209 Crownshield Ave Unit 19B
- 86 Hunter Rd
- 197 Crownshield Ave Unit 16B
- 197 Crownshield Ave Unit 16A
Your Personal Tour Guide
Ask me questions while you tour the home.