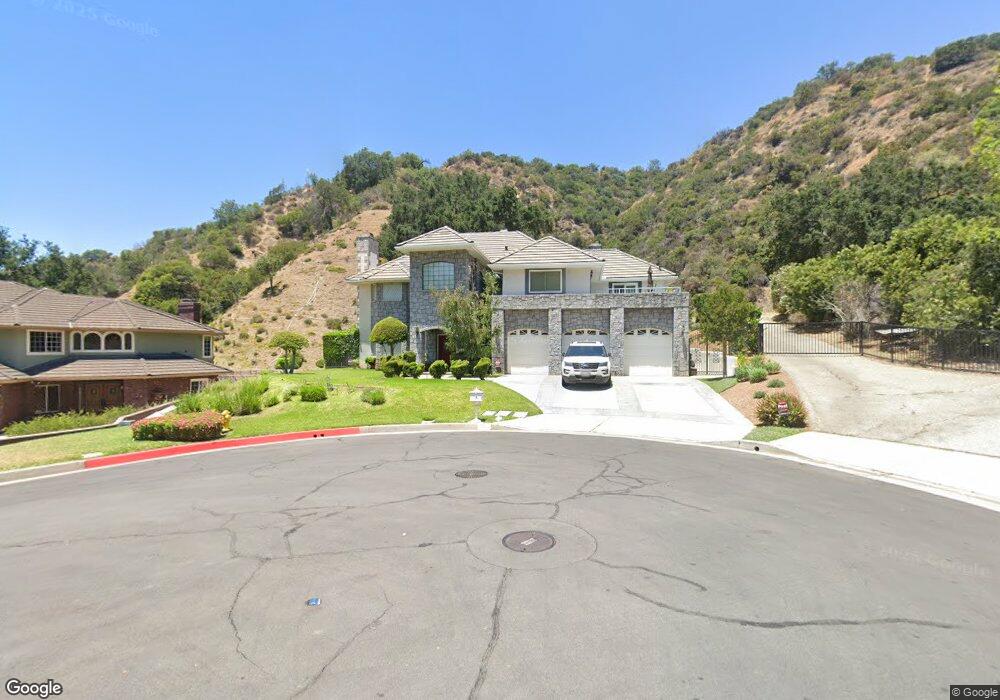
79 Hidden Valley Rd Monrovia, CA 91016
Estimated Value: $2,410,000 - $2,667,000
5
Beds
5
Baths
4,462
Sq Ft
$572/Sq Ft
Est. Value
About This Home
This home is located at 79 Hidden Valley Rd, Monrovia, CA 91016 and is currently estimated at $2,553,868, approximately $572 per square foot. 79 Hidden Valley Rd is a home located in Los Angeles County with nearby schools including Mayflower Elementary School, Clifton Middle School, and Monrovia High School.
Ownership History
Date
Name
Owned For
Owner Type
Purchase Details
Closed on
Oct 14, 2008
Sold by
Gold Hills Assoc
Bought by
Mckenna Robert E and Mckenna Lori A
Current Estimated Value
Purchase Details
Closed on
Dec 3, 2004
Sold by
Mckenna Lori A and Mckenna Robert
Bought by
Mckenna Robert E and Mckenna Lori A
Home Financials for this Owner
Home Financials are based on the most recent Mortgage that was taken out on this home.
Original Mortgage
$710,000
Interest Rate
5.25%
Mortgage Type
New Conventional
Purchase Details
Closed on
Feb 5, 2003
Sold by
Chu John Wen Kiang and Lin Mary Ling Cheng
Bought by
Miller Lori A and Mckenna Robert
Home Financials for this Owner
Home Financials are based on the most recent Mortgage that was taken out on this home.
Original Mortgage
$510,000
Interest Rate
5.82%
Create a Home Valuation Report for This Property
The Home Valuation Report is an in-depth analysis detailing your home's value as well as a comparison with similar homes in the area
Home Values in the Area
Average Home Value in this Area
Purchase History
| Date | Buyer | Sale Price | Title Company |
|---|---|---|---|
| Mckenna Robert E | $5,000 | None Available | |
| Mckenna Robert E | -- | Southland Title | |
| Miller Lori A | $960,000 | Equity Title Company |
Source: Public Records
Mortgage History
| Date | Status | Borrower | Loan Amount |
|---|---|---|---|
| Previous Owner | Mckenna Robert E | $710,000 | |
| Previous Owner | Miller Lori A | $510,000 | |
| Closed | Miller Lori A | $200,000 |
Source: Public Records
Tax History Compared to Growth
Tax History
| Year | Tax Paid | Tax Assessment Tax Assessment Total Assessment is a certain percentage of the fair market value that is determined by local assessors to be the total taxable value of land and additions on the property. | Land | Improvement |
|---|---|---|---|---|
| 2025 | $19,648 | $1,459,607 | $585,766 | $873,841 |
| 2024 | $19,648 | $1,430,988 | $574,281 | $856,707 |
| 2023 | $19,210 | $1,402,930 | $563,021 | $839,909 |
| 2022 | $18,663 | $1,375,423 | $551,982 | $823,441 |
| 2021 | $18,302 | $1,348,455 | $541,159 | $807,296 |
| 2019 | $17,434 | $1,308,461 | $525,109 | $783,352 |
| 2018 | $16,659 | $1,282,806 | $514,813 | $767,993 |
| 2017 | $16,334 | $1,257,654 | $504,719 | $752,935 |
| 2016 | $16,009 | $1,232,995 | $494,823 | $738,172 |
| 2015 | $15,658 | $1,214,475 | $487,391 | $727,084 |
| 2014 | $15,536 | $1,190,686 | $477,844 | $712,842 |
Source: Public Records
Map
Nearby Homes
- 582 N Alta Vista Ave
- 52 Hidden Valley Rd
- 23 Hidden Valley Rd
- 976 Ridgeside Dr
- 425 N Canyon Blvd
- 430 N Canyon Blvd
- 453 N Alta Vista Ave
- 375 N Canyon Blvd
- 347 Stedman Place
- 220 W Hillcrest Blvd
- 553 Norumbega Dr
- 314 May Ave
- 633 Norumbega Dr
- 277 Aspen Dr
- 700 Norumbega Dr
- 411 Sierra Vista Ave
- 208 Highland Place
- 337 Meadow Ln
- 549 Norumbega Dr
- 235 E Foothill Blvd Unit B
- 77 Hidden Valley Rd
- 73 Hidden Valley Rd
- 69 Hidden Valley Rd
- 583 N Alta Vista Ave
- 579 N Alta Vista Ave
- 589 N Alta Vista Ave
- 80 Hidden Valley Rd
- 575 N Alta Vista Ave
- 587 N Alta Vista Ave
- 65 Hidden Valley Rd
- 571 N Alta Vista Ave
- 61 Hidden Valley Rd
- 593 N Alta Vista Ave
- 567 N Alta Vista Ave
- 591 N Alta Vista Ave
- 572 N Alta Vista Ave
- 101 Sutter Creek
- 53 Hidden Valley Rd
- 563 N Alta Vista Ave
- 57 Hidden Valley Rd