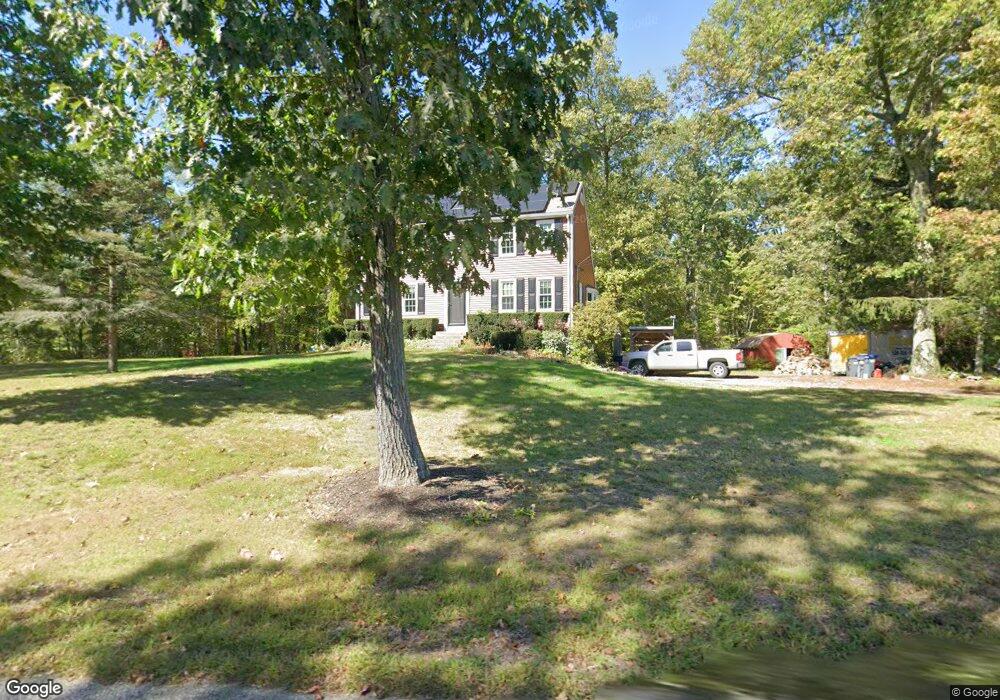
79 High St Plainville, MA 02762
Estimated Value: $595,124 - $691,000
3
Beds
2
Baths
1,800
Sq Ft
$354/Sq Ft
Est. Value
About This Home
This home is located at 79 High St, Plainville, MA 02762 and is currently estimated at $637,531, approximately $354 per square foot. 79 High St is a home located in Norfolk County with nearby schools including Anna Ware Jackson School, Beatrice H. Wood Elementary School, and Discovery Daycare Center.
Ownership History
Date
Name
Owned For
Owner Type
Purchase Details
Closed on
Jan 22, 1998
Sold by
Rodman Mark and Rodman Kristine
Bought by
Daniels Karen A
Current Estimated Value
Purchase Details
Closed on
Oct 29, 1992
Sold by
Morse Charles E and Morse Diane L
Bought by
Rodman Mark and Rodman Kristine
Purchase Details
Closed on
May 1, 1987
Sold by
Vannais Stephen C
Bought by
Morse Charles E
Create a Home Valuation Report for This Property
The Home Valuation Report is an in-depth analysis detailing your home's value as well as a comparison with similar homes in the area
Home Values in the Area
Average Home Value in this Area
Purchase History
| Date | Buyer | Sale Price | Title Company |
|---|---|---|---|
| Daniels Karen A | $177,000 | -- | |
| Daniels Karen A | $177,000 | -- | |
| Rodman Mark | $169,900 | -- | |
| Rodman Mark | $169,900 | -- | |
| Morse Charles E | $165,500 | -- |
Source: Public Records
Mortgage History
| Date | Status | Borrower | Loan Amount |
|---|---|---|---|
| Open | Morse Charles E | $210,000 | |
| Closed | Morse Charles E | $218,000 |
Source: Public Records
Tax History
| Year | Tax Paid | Tax Assessment Tax Assessment Total Assessment is a certain percentage of the fair market value that is determined by local assessors to be the total taxable value of land and additions on the property. | Land | Improvement |
|---|---|---|---|---|
| 2025 | $61 | $529,600 | $246,400 | $283,200 |
| 2024 | $5,764 | $480,300 | $224,500 | $255,800 |
| 2023 | $5,700 | $456,700 | $224,500 | $232,200 |
| 2022 | $5,486 | $391,000 | $216,400 | $174,600 |
| 2021 | $5,440 | $370,100 | $216,400 | $153,700 |
| 2020 | $5,339 | $363,200 | $216,400 | $146,800 |
| 2019 | $5,298 | $353,900 | $206,400 | $147,500 |
Source: Public Records
Map
Nearby Homes
Your Personal Tour Guide
Ask me questions while you tour the home.