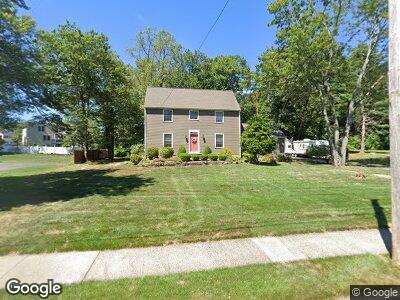
79 Hintz Dr Wallingford, CT 06492
Estimated Value: $443,368 - $509,000
2
Beds
2
Baths
1,728
Sq Ft
$279/Sq Ft
Est. Value
About This Home
This home is located at 79 Hintz Dr, Wallingford, CT 06492 and is currently estimated at $481,342, approximately $278 per square foot. 79 Hintz Dr is a home located in New Haven County with nearby schools including Highland Elementary School, Mary G. Fritz Elementary School, and James H. Moran Middle School.
Ownership History
Date
Name
Owned For
Owner Type
Purchase Details
Closed on
Jan 7, 2022
Sold by
Lee Tressyn L
Bought by
Pelaez Nilton
Current Estimated Value
Home Financials for this Owner
Home Financials are based on the most recent Mortgage that was taken out on this home.
Original Mortgage
$340,000
Outstanding Balance
$319,086
Interest Rate
3.12%
Mortgage Type
Purchase Money Mortgage
Estimated Equity
$145,272
Purchase Details
Closed on
Jun 1, 1984
Bought by
Memery Robert M
Create a Home Valuation Report for This Property
The Home Valuation Report is an in-depth analysis detailing your home's value as well as a comparison with similar homes in the area
Home Values in the Area
Average Home Value in this Area
Purchase History
| Date | Buyer | Sale Price | Title Company |
|---|---|---|---|
| Pelaez Nilton | $370,000 | None Available | |
| Memery Robert M | $112,000 | -- |
Source: Public Records
Mortgage History
| Date | Status | Borrower | Loan Amount |
|---|---|---|---|
| Open | Pelaez Nilton | $340,000 | |
| Previous Owner | Memery Robert M | $50,000 | |
| Previous Owner | Memery Robert M | $85,300 |
Source: Public Records
Tax History Compared to Growth
Tax History
| Year | Tax Paid | Tax Assessment Tax Assessment Total Assessment is a certain percentage of the fair market value that is determined by local assessors to be the total taxable value of land and additions on the property. | Land | Improvement |
|---|---|---|---|---|
| 2024 | $6,316 | $206,000 | $79,900 | $126,100 |
| 2023 | $6,044 | $206,000 | $79,900 | $126,100 |
| 2022 | $5,982 | $206,000 | $79,900 | $126,100 |
| 2021 | $5,875 | $206,000 | $79,900 | $126,100 |
| 2020 | $5,815 | $199,200 | $78,300 | $120,900 |
| 2019 | $5,815 | $199,200 | $78,300 | $120,900 |
| 2018 | $5,705 | $199,200 | $78,300 | $120,900 |
| 2017 | $5,687 | $199,200 | $78,300 | $120,900 |
| 2016 | $5,556 | $199,200 | $78,300 | $120,900 |
| 2015 | $5,725 | $208,400 | $78,300 | $130,100 |
| 2014 | $5,604 | $208,400 | $78,300 | $130,100 |
Source: Public Records
Map
Nearby Homes