79 Millbury St Worcester, MA 01610
Green Island NeighborhoodEstimated Value: $682,780
Studio
--
Bath
4,750
Sq Ft
$144/Sq Ft
Est. Value
About This Home
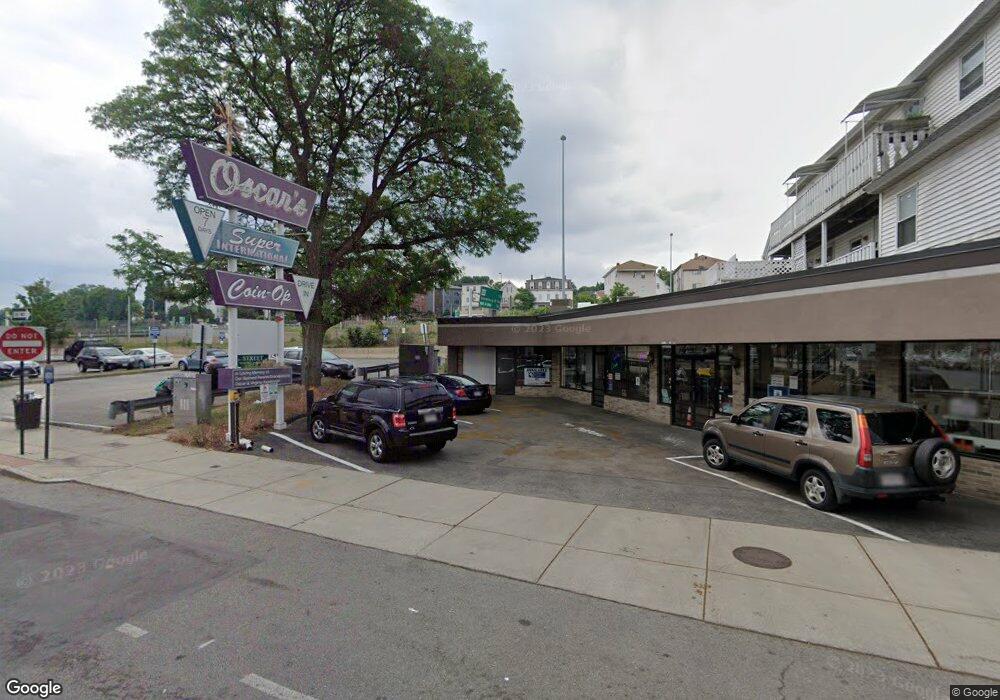
This home is located at 79 Millbury St, Worcester, MA 01610 and is currently estimated at $682,780, approximately $143 per square foot. 79 Millbury St is a home located in Worcester County with nearby schools including Jacob Hiatt Magnet School, Chandler Magnet, and Chandler Elementary Community School.
Ownership History
Date
Name
Owned For
Owner Type
Purchase Details
Closed on
Jun 9, 2025
Sold by
Mal Rich Realty Co Inc
Bought by
Hernandez Real Estate Llc
Current Estimated Value
Home Financials for this Owner
Home Financials are based on the most recent Mortgage that was taken out on this home.
Original Mortgage
$150,000
Outstanding Balance
$149,223
Interest Rate
6.81%
Mortgage Type
Purchase Money Mortgage
Estimated Equity
$533,557
Create a Home Valuation Report for This Property
The Home Valuation Report is an in-depth analysis detailing your home's value as well as a comparison with similar homes in the area
Home Values in the Area
Average Home Value in this Area
Purchase History
| Date | Buyer | Sale Price | Title Company |
|---|---|---|---|
| Hernandez Real Estate Llc | $700,000 | None Available | |
| Hernandez Real Estate Llc | $700,000 | None Available |
Source: Public Records
Mortgage History
| Date | Status | Borrower | Loan Amount |
|---|---|---|---|
| Open | Hernandez Real Estate Llc | $150,000 | |
| Closed | Hernandez Real Estate Llc | $150,000 |
Source: Public Records
Tax History
| Year | Tax Paid | Tax Assessment Tax Assessment Total Assessment is a certain percentage of the fair market value that is determined by local assessors to be the total taxable value of land and additions on the property. | Land | Improvement |
|---|---|---|---|---|
| 2025 | $26,639 | $931,100 | $237,900 | $693,200 |
| 2024 | -- | $779,500 | $237,900 | $541,600 |
| 2023 | $0 | $849,100 | $206,900 | $642,200 |
| 2022 | $0 | $708,400 | $206,900 | $501,500 |
| 2021 | $0 | $611,100 | $157,300 | $453,800 |
| 2020 | $0 | $582,900 | $157,300 | $425,600 |
| 2019 | $0 | $559,700 | $153,200 | $406,500 |
| 2018 | $0 | $543,100 | $153,200 | $389,900 |
| 2017 | $0 | $543,100 | $153,200 | $389,900 |
| 2016 | -- | $520,500 | $148,700 | $371,800 |
| 2015 | -- | $520,500 | $148,700 | $371,800 |
| 2014 | -- | $520,500 | $148,700 | $371,800 |
Source: Public Records
Map
Nearby Homes
- 49 Richland St
- 13 Sigel St
- 195 Millbury St
- 82 Fox St
- 79 Fox St
- 1 Arlington St
- 13 Sterling St
- 9 Winthrop St
- 22 Waverly St
- 64 Green St
- 32 Providence St Unit 5
- 26 South St
- 17 Euclid Ave
- 69 Oread St
- 49 South St
- 21 Mott St
- 112 Harrison St
- 70 Southbridge St Unit 611
- 70 Southbridge St Unit 310
- 70 Southbridge St Unit 703
Your Personal Tour Guide
Ask me questions while you tour the home.