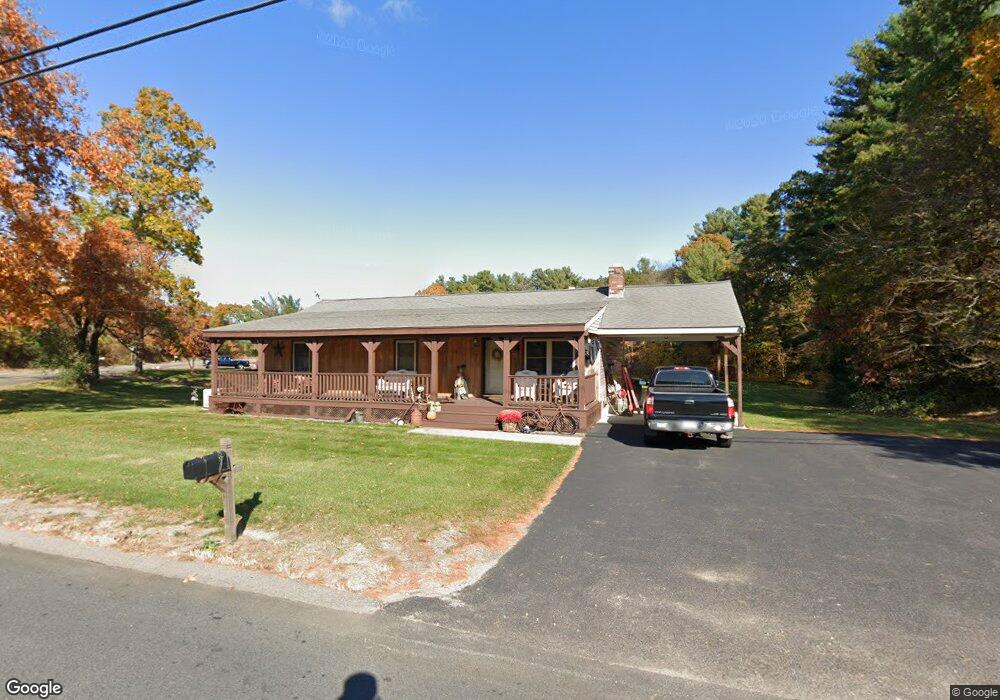
79 North St Bellingham, MA 02019
Estimated Value: $473,294 - $504,000
3
Beds
1
Bath
1,196
Sq Ft
$409/Sq Ft
Est. Value
About This Home
This home is located at 79 North St, Bellingham, MA 02019 and is currently estimated at $489,074, approximately $408 per square foot. 79 North St is a home located in Norfolk County with nearby schools including Joseph F. DiPietro Elementary, Bellingham High School, and Bethany Christian Academy.
Ownership History
Date
Name
Owned For
Owner Type
Purchase Details
Closed on
Jun 14, 2019
Sold by
Cournoyer Gerard
Bought by
Cournoyer Gerard and Brunetti Elaine
Current Estimated Value
Purchase Details
Closed on
Nov 18, 1982
Bought by
Cournoyer Gerard E
Create a Home Valuation Report for This Property
The Home Valuation Report is an in-depth analysis detailing your home's value as well as a comparison with similar homes in the area
Home Values in the Area
Average Home Value in this Area
Purchase History
| Date | Buyer | Sale Price | Title Company |
|---|---|---|---|
| Cournoyer Gerard | -- | -- | |
| Cournoyer Gerard E | $35,000 | -- |
Source: Public Records
Mortgage History
| Date | Status | Borrower | Loan Amount |
|---|---|---|---|
| Previous Owner | Cournoyer Gerard E | $40,000 | |
| Previous Owner | Cournoyer Gerard E | $77,947 | |
| Previous Owner | Cournoyer Gerard E | $47,300 |
Source: Public Records
Tax History
| Year | Tax Paid | Tax Assessment Tax Assessment Total Assessment is a certain percentage of the fair market value that is determined by local assessors to be the total taxable value of land and additions on the property. | Land | Improvement |
|---|---|---|---|---|
| 2025 | $5,258 | $418,600 | $171,200 | $247,400 |
| 2024 | $5,045 | $392,300 | $156,300 | $236,000 |
| 2023 | $4,864 | $372,700 | $148,900 | $223,800 |
| 2022 | $4,735 | $336,300 | $124,100 | $212,200 |
| 2021 | $4,604 | $319,500 | $124,100 | $195,400 |
| 2020 | $4,307 | $302,900 | $124,100 | $178,800 |
| 2019 | $4,218 | $296,800 | $124,100 | $172,700 |
| 2018 | $3,918 | $271,900 | $119,400 | $152,500 |
| 2017 | $3,814 | $266,000 | $119,400 | $146,600 |
| 2016 | $3,640 | $254,700 | $117,400 | $137,300 |
| 2015 | $3,480 | $244,200 | $112,900 | $131,300 |
| 2014 | $3,491 | $238,100 | $110,300 | $127,800 |
Source: Public Records
Map
Nearby Homes
- 5 Whitman Cir Unit 5
- 1 Whitman Cir Unit 1
- 3 Whitman Cir Unit 3
- 0 North St Unit 73440626
- 125 Blackstone St
- 1 Evergreen Dr Unit 1
- 5 Bernier Ln
- 31 Bellwood Cir Unit 31B
- 67 Blackstone St
- 7 Debra Ln Unit 1
- 23 Bellwood Cir Unit 23
- 36 Indian Run Rd
- 123-125 Mendon St
- 11 Quail Run Rd
- 3003 Maple Brook Rd Unit 3003
- 1501 Old Bridge Ln Unit 1501
- 640 Maple Brook Rd
- 7 Palmetto Dr Unit 7
- 6 Barrows Rd
- 352 Lake St
- 75 North St
- 284 Blackstone St
- 295 Blackstone St
- 76 North St
- 71 North St
- 289 Blackstone St
- 278 Blackstone St Unit 280
- 292 Blackstone St
- 2 Linda Way
- 296 Blackstone St
- 305 Blackstone St
- 272 Blackstone St Unit 274
- 69 North St
- 3 Linda Way
- 74 North St
- 1 Linda Way
- 4 Linda Way
- 300 Blackstone St
- 70 North St
- 5 Linda Way
Your Personal Tour Guide
Ask me questions while you tour the home.