Estimated Value: $413,246 - $428,000
4
Beds
3
Baths
2,484
Sq Ft
$170/Sq Ft
Est. Value
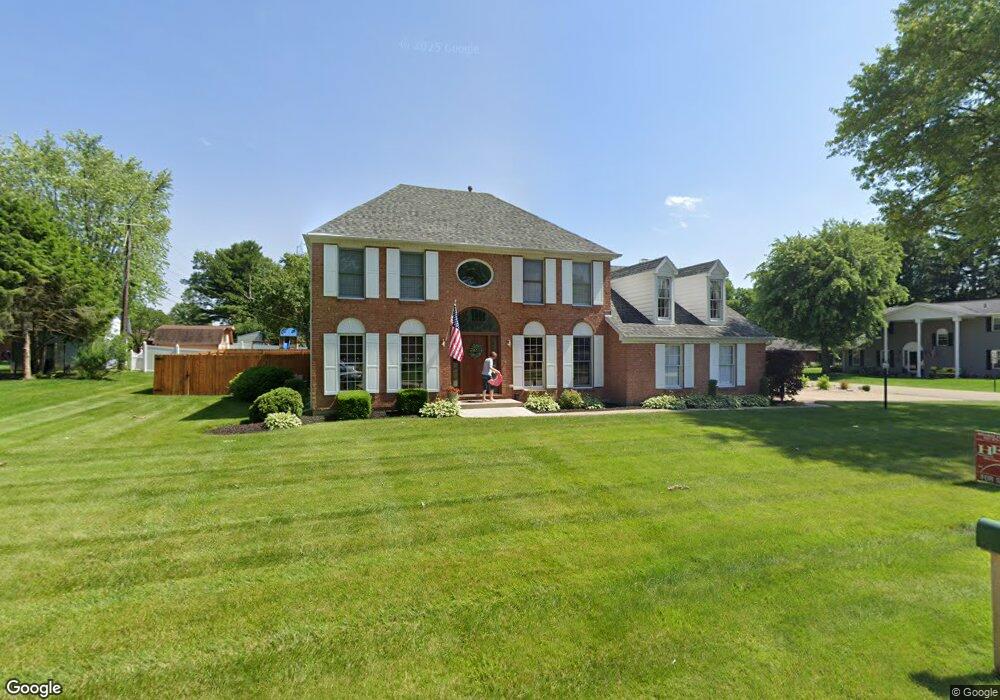
About This Home
This home is located at 79 Outerview Dr, Xenia, OH 45385 and is currently estimated at $423,312, approximately $170 per square foot. 79 Outerview Dr is a home located in Greene County with nearby schools including Xenia High School and Legacy Christian Academy.
Ownership History
Date
Name
Owned For
Owner Type
Purchase Details
Closed on
Jul 28, 2022
Sold by
May David and May Rhonda J
Bought by
Boyer Kristie D and Curtis Chad M
Current Estimated Value
Home Financials for this Owner
Home Financials are based on the most recent Mortgage that was taken out on this home.
Original Mortgage
$305,000
Outstanding Balance
$250,217
Interest Rate
4.67%
Mortgage Type
New Conventional
Estimated Equity
$173,095
Purchase Details
Closed on
Apr 15, 2016
Sold by
May Rhonda J
Bought by
May Rhonda J and May David
Purchase Details
Closed on
Dec 28, 2000
Sold by
May David J and May Rhonda J
Bought by
May Rhonda J
Home Financials for this Owner
Home Financials are based on the most recent Mortgage that was taken out on this home.
Original Mortgage
$180,000
Interest Rate
7.77%
Purchase Details
Closed on
Jun 29, 1999
Sold by
Erion John H and Erion Jana L
Bought by
May Rhonda J
Home Financials for this Owner
Home Financials are based on the most recent Mortgage that was taken out on this home.
Original Mortgage
$169,950
Interest Rate
7.29%
Mortgage Type
Balloon
Create a Home Valuation Report for This Property
The Home Valuation Report is an in-depth analysis detailing your home's value as well as a comparison with similar homes in the area
Home Values in the Area
Average Home Value in this Area
Purchase History
| Date | Buyer | Sale Price | Title Company |
|---|---|---|---|
| Boyer Kristie D | -- | None Listed On Document | |
| May Rhonda J | -- | None Available | |
| May Rhonda J | -- | -- | |
| May David J | -- | -- | |
| May Rhonda J | $188,900 | -- |
Source: Public Records
Mortgage History
| Date | Status | Borrower | Loan Amount |
|---|---|---|---|
| Open | Boyer Kristie D | $305,000 | |
| Previous Owner | May David J | $180,000 | |
| Previous Owner | May Rhonda J | $169,950 |
Source: Public Records
Tax History
| Year | Tax Paid | Tax Assessment Tax Assessment Total Assessment is a certain percentage of the fair market value that is determined by local assessors to be the total taxable value of land and additions on the property. | Land | Improvement |
|---|---|---|---|---|
| 2025 | $5,438 | $110,960 | $12,490 | $98,470 |
| 2024 | $5,438 | $109,560 | $12,490 | $97,070 |
| 2023 | $5,393 | $109,560 | $12,490 | $97,070 |
| 2022 | $4,392 | $81,890 | $10,410 | $71,480 |
| 2021 | $4,447 | $81,890 | $10,410 | $71,480 |
| 2020 | $4,274 | $81,890 | $10,410 | $71,480 |
| 2019 | $3,835 | $68,990 | $9,650 | $59,340 |
| 2018 | $3,849 | $68,990 | $9,650 | $59,340 |
| 2017 | $3,745 | $68,990 | $9,650 | $59,340 |
| 2016 | $3,562 | $64,440 | $9,650 | $54,790 |
| 2015 | $3,571 | $64,440 | $9,650 | $54,790 |
| 2014 | $3,426 | $64,440 | $9,650 | $54,790 |
Source: Public Records
Map
Nearby Homes
- 1038 Lark Ln
- 1809 Palmer Ct
- 1044 Whitestone Rd
- 1556 N Regency Dr
- 167 Beverly Place
- 955 Oak Dale Dr
- 1785 Tahoe Dr
- 2255 Monterey Dr
- 1461 Pavey Place
- 2096 Sierra Trail
- 289 Hollywood Blvd
- 1359 Eagles Way
- 453 Hollywood Blvd
- 461 Hollywood Blvd
- 634 Martin Dr
- 1785 Palmer Ct
- 1808 Palmer Ct
- 1796 Palmer Ct
- 1790 Palmer Ct
- 179 Omalee Dr
- 1076 Lark Ln
- 93 Outerview Dr
- 1075 Lark Ln
- 1075 Trianon Dr
- 63 Outerview Dr
- 96 Outerview Dr
- 1068 Lark Ln
- 1077 Lark Ln
- 1065 Trianon Dr
- 72 Outerview Dr
- 102 Outerview Dr
- 1054 Lark Ln
- 140 Outerview Cir
- 113 Outerview Dr
- 1055 Trianon Dr
- 120 Outerview Dr
- 169 Outerview Cir
- 118 Outerview Cir
- 1049 Lark Ln
- 1070 Trianon Dr
Your Personal Tour Guide
Ask me questions while you tour the home.