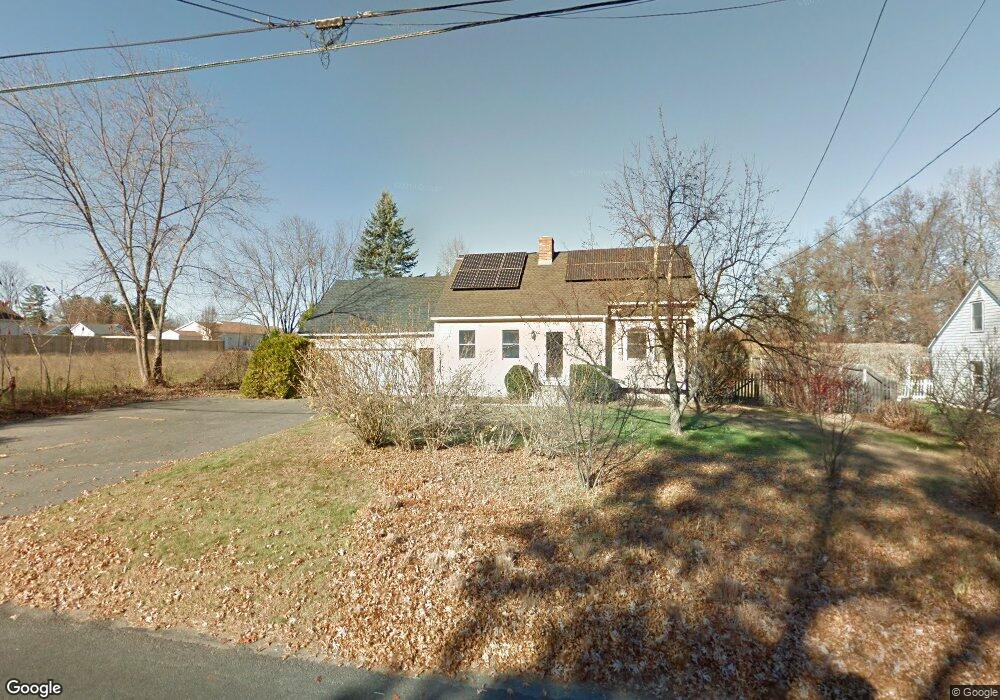
79 Plain St Easthampton, MA 01027
Estimated Value: $458,000 - $571,000
4
Beds
2
Baths
1,546
Sq Ft
$334/Sq Ft
Est. Value
About This Home
This home is located at 79 Plain St, Easthampton, MA 01027 and is currently estimated at $516,162, approximately $333 per square foot. 79 Plain St is a home located in Hampshire County with nearby schools including Easthampton High School, Calvary Baptist Christian School, and Tri-County Schools.
Ownership History
Date
Name
Owned For
Owner Type
Purchase Details
Closed on
Jul 11, 2017
Sold by
Meeropol Robert and Meeropol Ellen
Bought by
Bishop Holly M and Levine Alice J
Current Estimated Value
Home Financials for this Owner
Home Financials are based on the most recent Mortgage that was taken out on this home.
Original Mortgage
$132,000
Outstanding Balance
$109,850
Interest Rate
3.95%
Mortgage Type
New Conventional
Estimated Equity
$406,312
Purchase Details
Closed on
Oct 28, 1997
Sold by
Stevens John J and Stevens Marlene
Bought by
Meeropol Ellen and Meeropol Robert H
Home Financials for this Owner
Home Financials are based on the most recent Mortgage that was taken out on this home.
Original Mortgage
$112,000
Interest Rate
7.48%
Mortgage Type
Purchase Money Mortgage
Purchase Details
Closed on
Nov 20, 1989
Sold by
Fiszer Albert
Bought by
Stevens John J
Create a Home Valuation Report for This Property
The Home Valuation Report is an in-depth analysis detailing your home's value as well as a comparison with similar homes in the area
Home Values in the Area
Average Home Value in this Area
Purchase History
| Date | Buyer | Sale Price | Title Company |
|---|---|---|---|
| Bishop Holly M | $332,500 | -- | |
| Meeropol Ellen | $140,000 | -- | |
| Stevens John J | $130,000 | -- |
Source: Public Records
Mortgage History
| Date | Status | Borrower | Loan Amount |
|---|---|---|---|
| Open | Bishop Holly M | $132,000 | |
| Previous Owner | Stevens John J | $112,000 | |
| Previous Owner | Stevens John J | $28,000 | |
| Previous Owner | Stevens John J | $15,000 |
Source: Public Records
Tax History
| Year | Tax Paid | Tax Assessment Tax Assessment Total Assessment is a certain percentage of the fair market value that is determined by local assessors to be the total taxable value of land and additions on the property. | Land | Improvement |
|---|---|---|---|---|
| 2025 | $5,750 | $420,600 | $109,900 | $310,700 |
| 2024 | $5,556 | $409,700 | $106,900 | $302,800 |
| 2023 | $4,124 | $281,500 | $84,100 | $197,400 |
| 2022 | $4,653 | $281,500 | $84,100 | $197,400 |
| 2021 | $5,146 | $293,400 | $84,100 | $209,300 |
| 2020 | $4,999 | $281,500 | $84,100 | $197,400 |
| 2019 | $4,166 | $269,500 | $84,100 | $185,400 |
| 2018 | $3,653 | $228,300 | $79,300 | $149,000 |
| 2017 | $3,568 | $220,100 | $76,200 | $143,900 |
| 2016 | $3,592 | $230,400 | $76,200 | $154,200 |
| 2015 | $3,491 | $230,400 | $76,200 | $154,200 |
Source: Public Records
Map
Nearby Homes
Your Personal Tour Guide
Ask me questions while you tour the home.