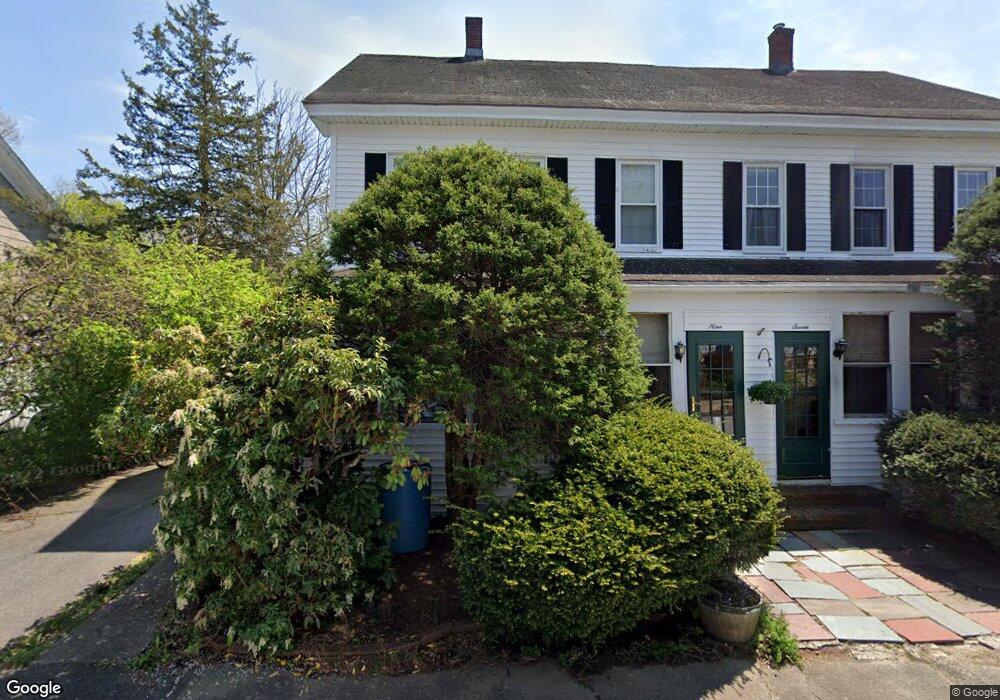
79 Pleasant St Maynard, MA 01754
Estimated Value: $510,000 - $674,000
6
Beds
4
Baths
3,071
Sq Ft
$202/Sq Ft
Est. Value
About This Home
This home is located at 79 Pleasant St, Maynard, MA 01754 and is currently estimated at $620,086, approximately $201 per square foot. 79 Pleasant St is a home located in Middlesex County with nearby schools including Green Meadow School, Fowler School, and Maynard High School.
Ownership History
Date
Name
Owned For
Owner Type
Purchase Details
Closed on
Jun 6, 2008
Sold by
Manning Anne
Bought by
Manning Anne E and Manning Kevin W
Current Estimated Value
Purchase Details
Closed on
Sep 2, 2004
Sold by
Dzerkacz Jessie J and Dzerkacz John
Bought by
Manning Anne E
Purchase Details
Closed on
Feb 23, 1965
Bought by
Manning Kevin W and Manning Anne E
Create a Home Valuation Report for This Property
The Home Valuation Report is an in-depth analysis detailing your home's value as well as a comparison with similar homes in the area
Home Values in the Area
Average Home Value in this Area
Purchase History
| Date | Buyer | Sale Price | Title Company |
|---|---|---|---|
| Manning Anne E | -- | -- | |
| Manning Anne E | -- | -- | |
| Manning Anne E | -- | -- | |
| Manning Anne E | -- | -- | |
| Manning Kevin W | -- | -- |
Source: Public Records
Mortgage History
| Date | Status | Borrower | Loan Amount |
|---|---|---|---|
| Open | Manning Kevin W | $100,100 |
Source: Public Records
Tax History Compared to Growth
Tax History
| Year | Tax Paid | Tax Assessment Tax Assessment Total Assessment is a certain percentage of the fair market value that is determined by local assessors to be the total taxable value of land and additions on the property. | Land | Improvement |
|---|---|---|---|---|
| 2025 | $8,979 | $503,600 | $275,500 | $228,100 |
| 2024 | $8,768 | $490,400 | $262,300 | $228,100 |
| 2023 | $8,736 | $460,500 | $246,300 | $214,200 |
| 2022 | $8,789 | $428,300 | $214,100 | $214,200 |
| 2021 | $8,324 | $413,100 | $208,800 | $204,300 |
| 2020 | $8,417 | $407,800 | $203,400 | $204,400 |
| 2019 | $7,135 | $339,100 | $179,300 | $159,800 |
| 2018 | $6,554 | $289,500 | $157,400 | $132,100 |
| 2017 | $6,372 | $289,500 | $157,400 | $132,100 |
| 2016 | $6,152 | $289,500 | $157,400 | $132,100 |
Source: Public Records
Map
Nearby Homes
- 2 Wall Ct
- 30 Acton St
- 37 Glendale St
- 22-26 Waltham St
- 91 Nason St
- 28 Waltham St Unit A
- 28 Waltham St Unit B
- 17 Prospect St
- 22 Garfield Ave
- 12 Walcott St
- 30-32 Walnut St
- 13 Arthur St Unit 15
- 15 Arthur St Unit 15
- 5 Hayes St Unit 5
- 66 Powder Mill Rd
- 69 Powder Mill Rd
- 2 & 6 Powder Mill Rd
- 7 King St
- 20 Tremont St
- 5 Oak Ridge Dr Unit 7
- 11 Pleasant St
- 11 Pleasant St
- 35 Pleasant St
- 5 Pleasant St
- 12 Pleasant St
- 5-1/2 Pleasant St
- 4 Oscar's Way (Lot 4)
- 5 1/2 Pleasant St
- 13 Pleasant St
- 12 Pleasant St
- 10 Pleasant St
- 14 Pleasant St
- 8 Pleasant St
- 46 Pleasant St
- 3 Acton Ct
- 16 Pleasant St
- 79 Acton Ct
- 7 Acton Ct Unit 2nd
- 7 Acton Ct Unit 7
- 1 Acton Ct