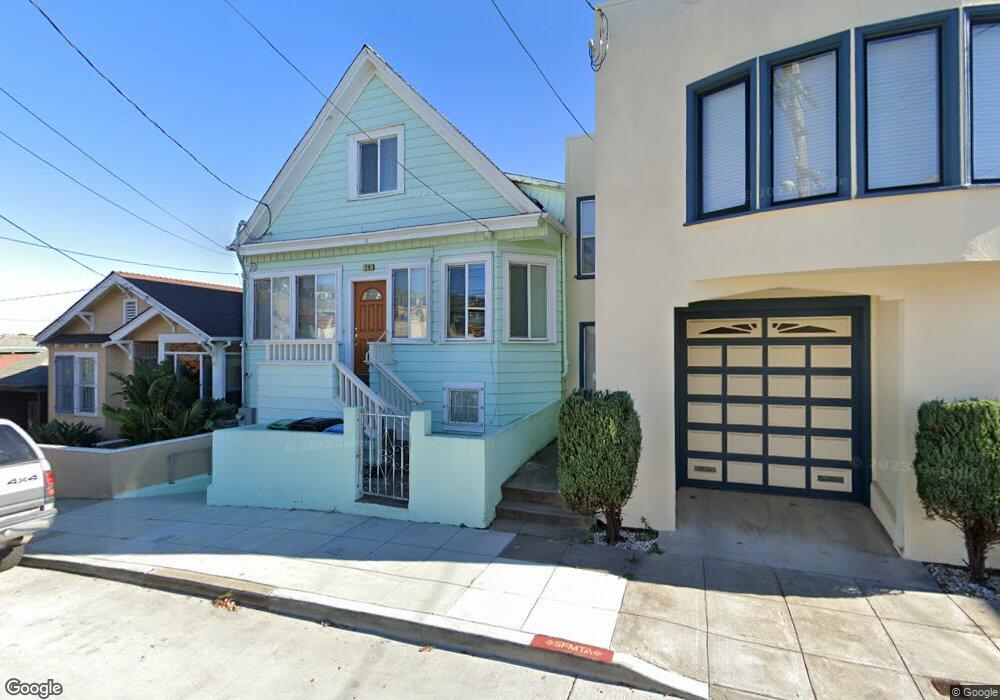
79 Putnam St San Francisco, CA 94110
Bernal Heights NeighborhoodEstimated Value: $1,581,000 - $1,828,000
4
Beds
2
Baths
2,271
Sq Ft
$746/Sq Ft
Est. Value
About This Home
This home is located at 79 Putnam St, San Francisco, CA 94110 and is currently estimated at $1,694,891, approximately $746 per square foot. 79 Putnam St is a home located in San Francisco County with nearby schools including Leonard R. Flynn Elementary, James Lick Middle School, and Donum Dei Classical Academy.
Ownership History
Date
Name
Owned For
Owner Type
Purchase Details
Closed on
Oct 22, 2024
Sold by
Moore Douglas
Bought by
Moore Laura
Current Estimated Value
Purchase Details
Closed on
Jun 16, 2021
Sold by
Moore Laura Corrine
Bought by
Laura Moore Living Trust and Moore
Purchase Details
Closed on
Apr 30, 2004
Sold by
Anderson Michael Cantwell and Camp Laura Corrine
Bought by
Anderson Michael Cantwell and Camp Laura Corrine
Home Financials for this Owner
Home Financials are based on the most recent Mortgage that was taken out on this home.
Original Mortgage
$75,000
Interest Rate
5.5%
Mortgage Type
Credit Line Revolving
Create a Home Valuation Report for This Property
The Home Valuation Report is an in-depth analysis detailing your home's value as well as a comparison with similar homes in the area
Home Values in the Area
Average Home Value in this Area
Purchase History
| Date | Buyer | Sale Price | Title Company |
|---|---|---|---|
| Moore Laura | -- | First American Title | |
| Laura Moore Living Trust | -- | None Listed On Document | |
| Anderson Michael Cantwell | -- | First American Title Company |
Source: Public Records
Mortgage History
| Date | Status | Borrower | Loan Amount |
|---|---|---|---|
| Previous Owner | Anderson Michael Cantwell | $75,000 |
Source: Public Records
Tax History
| Year | Tax Paid | Tax Assessment Tax Assessment Total Assessment is a certain percentage of the fair market value that is determined by local assessors to be the total taxable value of land and additions on the property. | Land | Improvement |
|---|---|---|---|---|
| 2025 | $4,659 | $344,090 | $135,318 | $208,772 |
| 2024 | $4,659 | $337,346 | $132,666 | $204,680 |
| 2023 | $4,579 | $330,734 | $130,066 | $200,668 |
| 2022 | $4,475 | $324,252 | $127,517 | $196,735 |
| 2021 | $4,390 | $317,896 | $125,017 | $192,879 |
| 2020 | $4,427 | $314,640 | $123,736 | $190,904 |
| 2019 | $4,278 | $308,472 | $121,310 | $187,162 |
| 2018 | $4,134 | $302,426 | $118,932 | $183,494 |
| 2017 | $3,786 | $296,499 | $116,600 | $179,899 |
| 2016 | $3,697 | $290,689 | $114,315 | $176,374 |
| 2015 | $3,382 | $286,325 | $112,599 | $173,726 |
| 2014 | $3,552 | $280,718 | $110,394 | $170,324 |
Source: Public Records
Map
Nearby Homes
- 332 Bradford St
- 121 Bradford St
- 360 Bradford St
- 532 Franconia St
- 54 Bradford St
- 661 Peralta Ave
- 4007 Folsom St
- 151 Anderson St
- 287 Moultrie St
- 537 Moultrie St
- 546 Ellsworth St
- 400 Franconia St
- 130 Ripley St
- 709 Eugenia Ave
- 1000 Crescent Ave
- 719 Banks St
- 100 Gaven St
- 4 Norwich St
- 344 Holladay Ave
- 773 Gates St
Your Personal Tour Guide
Ask me questions while you tour the home.