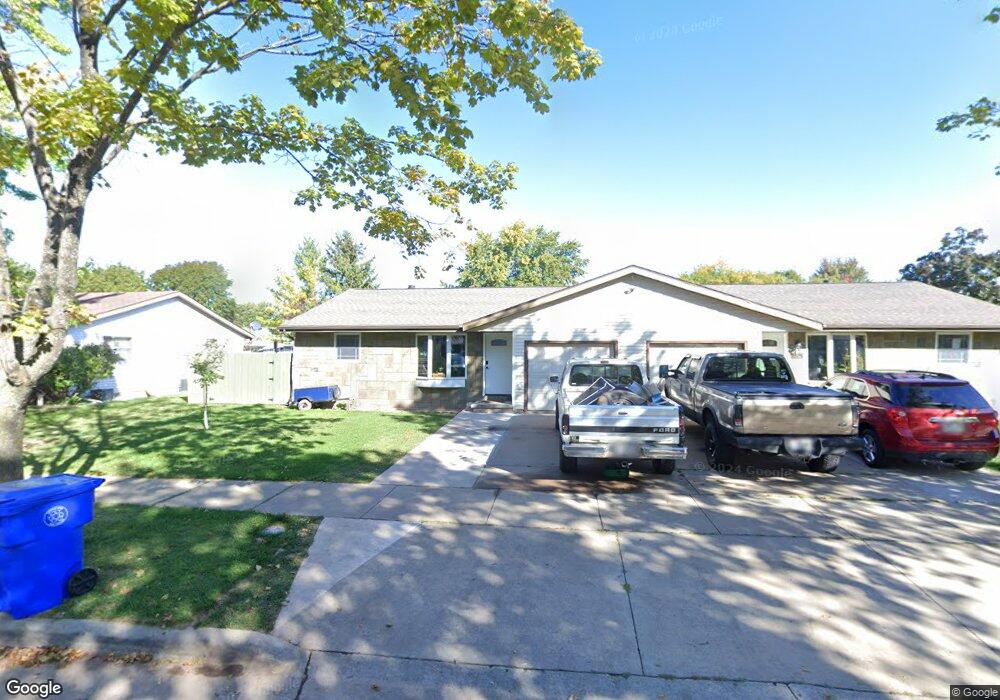
79 Solar Cir Appleton, WI 54915
South Appleton NeighborhoodEstimated Value: $307,000 - $386,000
4
Beds
2
Baths
2,067
Sq Ft
$174/Sq Ft
Est. Value
About This Home
This home is located at 79 Solar Cir, Appleton, WI 54915 and is currently estimated at $358,667, approximately $173 per square foot. 79 Solar Cir is a home with nearby schools including Horizons Elementary School, James Madison Middle School, and Appleton East High School.
Ownership History
Date
Name
Owned For
Owner Type
Purchase Details
Closed on
May 23, 2018
Sold by
Zoeller William J
Bought by
Carson Steve M
Current Estimated Value
Home Financials for this Owner
Home Financials are based on the most recent Mortgage that was taken out on this home.
Original Mortgage
$174,060
Outstanding Balance
$150,215
Interest Rate
4.5%
Mortgage Type
VA
Estimated Equity
$208,452
Purchase Details
Closed on
Sep 27, 2005
Sold by
Roehrig Jon A and Roehrig Annette L
Bought by
Zoeller William J
Home Financials for this Owner
Home Financials are based on the most recent Mortgage that was taken out on this home.
Original Mortgage
$148,195
Interest Rate
5.88%
Mortgage Type
New Conventional
Purchase Details
Closed on
Sep 16, 2005
Sold by
Vander Zanden John F and Piepenburg Joel
Bought by
Roehrig Jon A and Roehrig Annette L
Home Financials for this Owner
Home Financials are based on the most recent Mortgage that was taken out on this home.
Original Mortgage
$148,195
Interest Rate
5.88%
Mortgage Type
New Conventional
Create a Home Valuation Report for This Property
The Home Valuation Report is an in-depth analysis detailing your home's value as well as a comparison with similar homes in the area
Home Values in the Area
Average Home Value in this Area
Purchase History
| Date | Buyer | Sale Price | Title Company |
|---|---|---|---|
| Carson Steve M | $168,500 | -- | |
| Zoeller William J | $151,500 | None Available | |
| Roehrig Jon A | -- | None Available |
Source: Public Records
Mortgage History
| Date | Status | Borrower | Loan Amount |
|---|---|---|---|
| Open | Carson Steve M | $174,060 | |
| Previous Owner | Zoeller William J | $148,195 |
Source: Public Records
Tax History
| Year | Tax Paid | Tax Assessment Tax Assessment Total Assessment is a certain percentage of the fair market value that is determined by local assessors to be the total taxable value of land and additions on the property. | Land | Improvement |
|---|---|---|---|---|
| 2024 | -- | $274,700 | $46,800 | $227,900 |
| 2023 | $4,518 | $274,700 | $46,800 | $227,900 |
| 2022 | $3,849 | $170,100 | $37,400 | $132,700 |
| 2021 | $3,775 | $170,100 | $37,400 | $132,700 |
| 2020 | $3,669 | $170,100 | $37,400 | $132,700 |
| 2019 | $3,520 | $170,100 | $37,400 | $132,700 |
| 2018 | $3,328 | $144,900 | $34,900 | $110,000 |
| 2017 | $3,472 | $144,900 | $34,900 | $110,000 |
| 2016 | $3,179 | $144,900 | $34,900 | $110,000 |
| 2015 | $3,173 | $144,900 | $34,900 | $110,000 |
| 2013 | $4,197 | $156,500 | $34,900 | $121,600 |
Source: Public Records
Map
Nearby Homes
- 39 Welcome Cir
- 63 Brentwood Ln
- 1831 E Sylvan Ave
- 1821 E Sylvan Ave
- 1819 E Sylvan Ave
- N9254 Homestead Ln
- 2362 E Plank Rd Unit D
- 1734 S Rebecca Ln
- N9359 Gemstone Ct
- 1443 E Calumet St
- 1700 E Midway Rd
- 1421 E Midway Rd
- N9330 Gemstone Ct
- 1426 E Calumet St
- N9315 Gemstone Ct
- N9272 Constellation Dr
- N9292 Constellation Dr
- N9284 Constellation Dr
- 1601 S Sundown Ln
- N9273 Constellation Dr
Your Personal Tour Guide
Ask me questions while you tour the home.