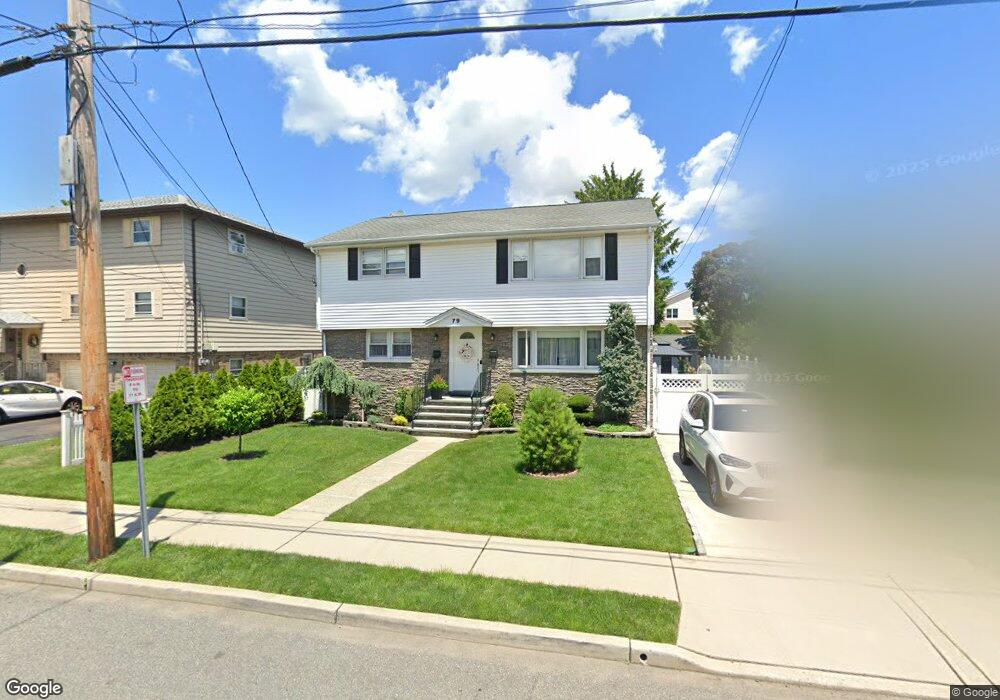
79 Tuttle St Wallington, NJ 07057
Estimated Value: $724,342 - $825,000
2
Beds
1
Bath
2,052
Sq Ft
$372/Sq Ft
Est. Value
About This Home
This home is located at 79 Tuttle St, Wallington, NJ 07057 and is currently estimated at $764,086, approximately $372 per square foot. 79 Tuttle St is a home located in Bergen County with nearby schools including Wallington Jr Sr High School and Passaic Arts & Science Charter School.
Ownership History
Date
Name
Owned For
Owner Type
Purchase Details
Closed on
Jun 8, 2015
Sold by
Kosakowski Arkadiusz and Kosakowski Monika
Bought by
Kosakowski Monika
Current Estimated Value
Home Financials for this Owner
Home Financials are based on the most recent Mortgage that was taken out on this home.
Original Mortgage
$264,000
Interest Rate
3.87%
Mortgage Type
New Conventional
Purchase Details
Closed on
Dec 3, 2003
Sold by
Pilat Helen
Bought by
Kosakowski Arkadiusz and Kosakowski Monika
Home Financials for this Owner
Home Financials are based on the most recent Mortgage that was taken out on this home.
Original Mortgage
$330,000
Interest Rate
5.96%
Create a Home Valuation Report for This Property
The Home Valuation Report is an in-depth analysis detailing your home's value as well as a comparison with similar homes in the area
Home Values in the Area
Average Home Value in this Area
Purchase History
| Date | Buyer | Sale Price | Title Company |
|---|---|---|---|
| Kosakowski Monika | -- | Attorney | |
| Kosakowski Arkadiusz | $430,000 | -- |
Source: Public Records
Mortgage History
| Date | Status | Borrower | Loan Amount |
|---|---|---|---|
| Previous Owner | Kosakowski Monika | $264,000 | |
| Previous Owner | Kosakowski Arkadiusz | $330,000 |
Source: Public Records
Tax History
| Year | Tax Paid | Tax Assessment Tax Assessment Total Assessment is a certain percentage of the fair market value that is determined by local assessors to be the total taxable value of land and additions on the property. | Land | Improvement |
|---|---|---|---|---|
| 2025 | $11,506 | $609,800 | $272,800 | $337,000 |
| 2024 | $11,069 | $338,300 | $172,500 | $165,800 |
| 2023 | $10,839 | $338,300 | $172,500 | $165,800 |
| 2022 | $10,839 | $338,300 | $172,500 | $165,800 |
| 2021 | $10,653 | $338,300 | $172,500 | $165,800 |
| 2020 | $10,437 | $338,300 | $172,500 | $165,800 |
| 2019 | $10,105 | $338,300 | $172,500 | $165,800 |
| 2018 | $9,987 | $338,300 | $172,500 | $165,800 |
| 2017 | $9,861 | $338,300 | $172,500 | $165,800 |
| 2016 | $9,669 | $338,300 | $172,500 | $165,800 |
| 2015 | $9,256 | $338,300 | $172,500 | $165,800 |
| 2014 | $8,782 | $338,300 | $172,500 | $165,800 |
Source: Public Records
Map
Nearby Homes
- 39 Tuttle St
- 94 Locust Ave
- 84 Locust Ave
- 7 Azalea Dr
- 119 Halstead Ave
- 29 Mount Pleasant Ave
- 159 Anderson Ave
- 62 Johnson Ave
- 104 Wallington Ave
- 48 Main Ave
- 5 Bobbink Terrace
- 106-110 Hayward Place
- 89 Anderson Ave Unit 2
- 89 Anderson Ave
- 75 Midland Ave
- 15 Wallington Ave
- 82 Herrick St
- 32 Hayward Place
- 117 10th St
- 95 Atkins Terrace
Your Personal Tour Guide
Ask me questions while you tour the home.