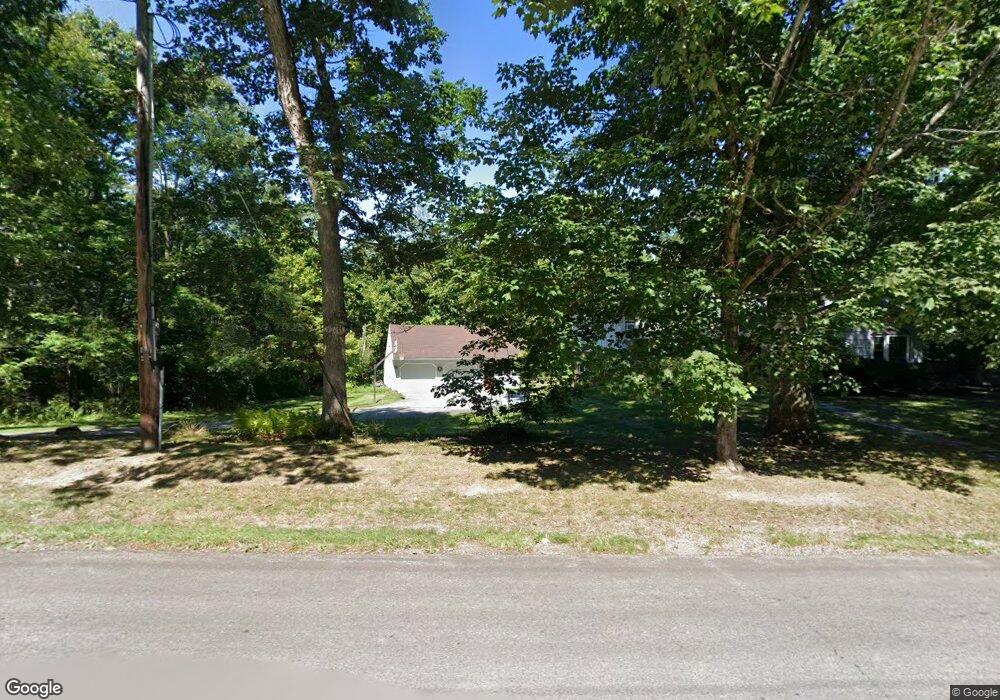
79 Twiss Ln Hollis, NH 03049
Hollis NeighborhoodEstimated Value: $651,739 - $1,063,000
4
Beds
3
Baths
1,556
Sq Ft
$520/Sq Ft
Est. Value
About This Home
This home is located at 79 Twiss Ln, Hollis, NH 03049 and is currently estimated at $808,935, approximately $519 per square foot. 79 Twiss Ln is a home with nearby schools including Hollis Primary School, Hollis Upper Elementary School, and Hollis-Brookline Middle School.
Ownership History
Date
Name
Owned For
Owner Type
Purchase Details
Closed on
Jun 16, 2003
Sold by
White Amos T
Bought by
Keldsen Kyle L and Keldsen Leslie M
Current Estimated Value
Home Financials for this Owner
Home Financials are based on the most recent Mortgage that was taken out on this home.
Original Mortgage
$299,900
Interest Rate
5.77%
Purchase Details
Closed on
May 1, 2001
Sold by
Wilton S Jones Rt
Bought by
White Amos T
Home Financials for this Owner
Home Financials are based on the most recent Mortgage that was taken out on this home.
Original Mortgage
$247,920
Interest Rate
6.88%
Create a Home Valuation Report for This Property
The Home Valuation Report is an in-depth analysis detailing your home's value as well as a comparison with similar homes in the area
Home Values in the Area
Average Home Value in this Area
Purchase History
| Date | Buyer | Sale Price | Title Company |
|---|---|---|---|
| Keldsen Kyle L | $374,900 | -- | |
| White Amos T | $309,900 | -- |
Source: Public Records
Mortgage History
| Date | Status | Borrower | Loan Amount |
|---|---|---|---|
| Open | White Amos T | $256,000 | |
| Closed | White Amos T | $299,900 | |
| Previous Owner | White Amos T | $247,920 |
Source: Public Records
Tax History Compared to Growth
Tax History
| Year | Tax Paid | Tax Assessment Tax Assessment Total Assessment is a certain percentage of the fair market value that is determined by local assessors to be the total taxable value of land and additions on the property. | Land | Improvement |
|---|---|---|---|---|
| 2024 | $10,455 | $589,700 | $307,200 | $282,500 |
| 2023 | $9,824 | $589,700 | $307,200 | $282,500 |
| 2022 | $13,310 | $589,700 | $307,200 | $282,500 |
| 2021 | $8,553 | $376,800 | $207,600 | $169,200 |
| 2020 | $8,734 | $376,800 | $207,600 | $169,200 |
| 2019 | $8,704 | $376,800 | $207,600 | $169,200 |
| 2018 | $8,165 | $376,800 | $207,600 | $169,200 |
| 2017 | $7,660 | $330,900 | $184,600 | $146,300 |
| 2016 | $7,753 | $330,900 | $184,600 | $146,300 |
| 2015 | $7,617 | $330,900 | $184,600 | $146,300 |
| 2014 | $7,654 | $330,900 | $184,600 | $146,300 |
| 2013 | $7,551 | $330,900 | $184,600 | $146,300 |
Source: Public Records
Map
Nearby Homes