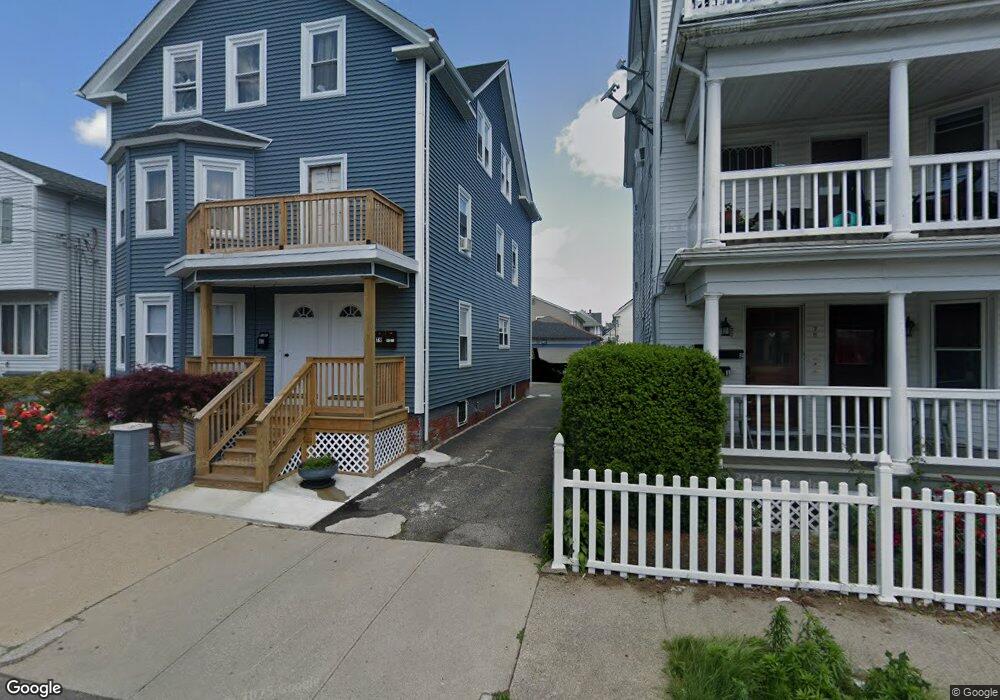
79 Wallace St Providence, RI 02909
Silver Lake NeighborhoodEstimated Value: $619,000 - $663,000
6
Beds
3
Baths
3,276
Sq Ft
$196/Sq Ft
Est. Value
About This Home
This home is located at 79 Wallace St, Providence, RI 02909 and is currently estimated at $641,000, approximately $195 per square foot. 79 Wallace St is a home located in Providence County with nearby schools including Achievement First Promesa, Achievement First Providence Mayoral Academy Elementary School, and Achievement First Providence Mayoral Academy Elementary.
Ownership History
Date
Name
Owned For
Owner Type
Purchase Details
Closed on
Aug 27, 2024
Sold by
Carranza Hugo R and Villagran Luz A
Bought by
Carranza Hugo R and Villagran Luz A
Current Estimated Value
Home Financials for this Owner
Home Financials are based on the most recent Mortgage that was taken out on this home.
Original Mortgage
$320,000
Outstanding Balance
$315,118
Interest Rate
6.77%
Mortgage Type
Stand Alone Refi Refinance Of Original Loan
Estimated Equity
$325,882
Purchase Details
Closed on
Sep 11, 1996
Sold by
Saul James M
Bought by
Carranza Hugo R and Villagran Luz Amalia
Home Financials for this Owner
Home Financials are based on the most recent Mortgage that was taken out on this home.
Original Mortgage
$74,949
Interest Rate
8.18%
Mortgage Type
Purchase Money Mortgage
Create a Home Valuation Report for This Property
The Home Valuation Report is an in-depth analysis detailing your home's value as well as a comparison with similar homes in the area
Home Values in the Area
Average Home Value in this Area
Purchase History
| Date | Buyer | Sale Price | Title Company |
|---|---|---|---|
| Carranza Hugo R | -- | None Available | |
| Carranza Hugo R | -- | None Available | |
| Carranza Hugo R | -- | None Available | |
| Carranza Hugo R | $75,000 | -- | |
| Carranza Hugo R | $75,000 | -- |
Source: Public Records
Mortgage History
| Date | Status | Borrower | Loan Amount |
|---|---|---|---|
| Open | Carranza Hugo R | $320,000 | |
| Closed | Carranza Hugo R | $320,000 | |
| Previous Owner | Carranza Hugo R | $272,000 | |
| Previous Owner | Carranza Hugo R | $74,949 |
Source: Public Records
Tax History
| Year | Tax Paid | Tax Assessment Tax Assessment Total Assessment is a certain percentage of the fair market value that is determined by local assessors to be the total taxable value of land and additions on the property. | Land | Improvement |
|---|---|---|---|---|
| 2025 | $8,014 | $572,400 | $128,000 | $444,400 |
| 2024 | $5,626 | $306,600 | $72,000 | $234,600 |
| 2023 | $5,626 | $306,600 | $72,000 | $234,600 |
| 2022 | $5,457 | $306,600 | $72,000 | $234,600 |
| 2021 | $5,344 | $217,600 | $45,800 | $171,800 |
| 2020 | $5,344 | $217,600 | $45,800 | $171,800 |
| 2019 | $5,344 | $217,600 | $45,800 | $171,800 |
| 2018 | $4,596 | $143,800 | $44,400 | $99,400 |
| 2017 | $4,596 | $143,800 | $44,400 | $99,400 |
| 2016 | $4,596 | $143,800 | $44,400 | $99,400 |
| 2015 | $4,174 | $126,100 | $47,100 | $79,000 |
| 2014 | $4,256 | $126,100 | $47,100 | $79,000 |
| 2013 | $4,256 | $126,100 | $47,100 | $79,000 |
Source: Public Records
Map
Nearby Homes
- 4 Priscilla Ave
- 66 Progress Ave
- 79 Priscilla Ave
- 108 Roosevelt St
- 19 Dora St
- 160 Magnolia St
- 29 Dunford St
- 17 Judith St
- 15 Judith St
- 293 Webster Ave
- 41 Terrace Ave
- 283 Waldo St
- 64 Ralph St
- 122 Laban St
- 102 Ellery St
- 70 Rosedale St Unit 1
- 173 Whittier Ave
- 69 Sorrento St Unit 71
- 30 Rosedale St
- 11 Hillhurst Ave
- 75 Wallace St
- 83 Wallace St
- 71 Wallace St
- 87 Wallace St
- 86 Clarence St
- 69 Wallace St Unit 3
- 94 Clarence St
- 84 Clarence St
- 67 Wallace St
- 67 Wallace St Unit 1
- 80 Clarence St
- 80 Clarence St Unit 2
- 98 Clarence St
- 80 Wallace St
- 76 Wallace St
- 74 Wallace St
- 78 Wallace St
- 38 Priscilla Ave
- 82 Wallace St
- 78 Clarence St
Your Personal Tour Guide
Ask me questions while you tour the home.