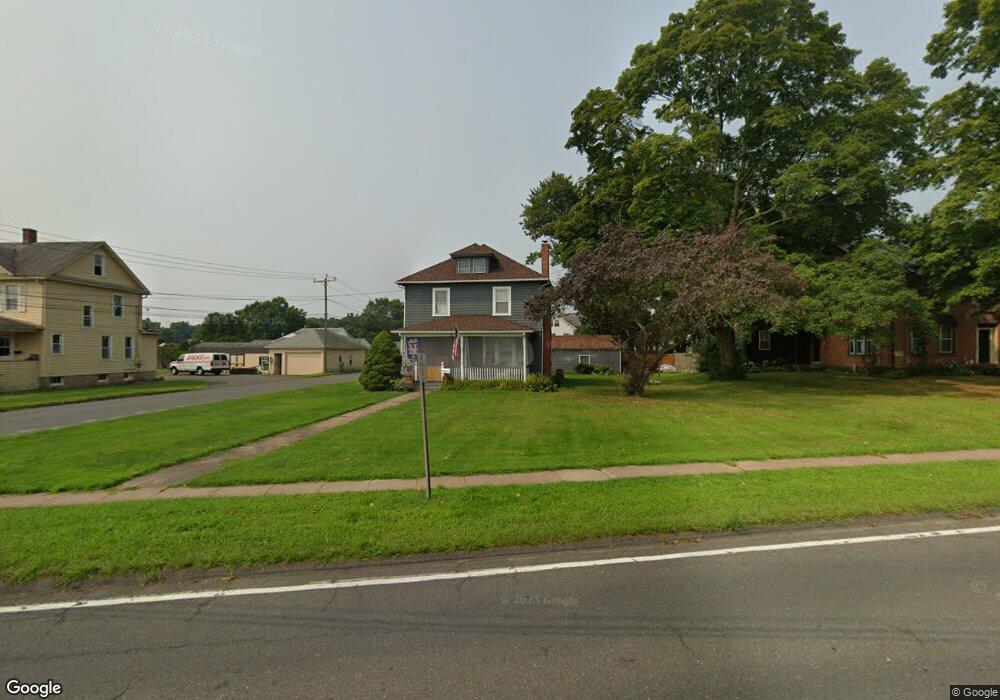
79 West St Cromwell, CT 06416
Estimated Value: $364,450 - $438,000
4
Beds
2
Baths
1,560
Sq Ft
$252/Sq Ft
Est. Value
About This Home
This home is located at 79 West St, Cromwell, CT 06416 and is currently estimated at $392,363, approximately $251 per square foot. 79 West St is a home located in Middlesex County with nearby schools including Edna C. Stevens School, Woodside Intermediate School, and Cromwell Middle School.
Ownership History
Date
Name
Owned For
Owner Type
Purchase Details
Closed on
Jun 16, 2004
Sold by
Bugai Robert P and Bugai Jennifer
Bought by
Klein William A and Clark Gwen
Current Estimated Value
Home Financials for this Owner
Home Financials are based on the most recent Mortgage that was taken out on this home.
Original Mortgage
$179,600
Outstanding Balance
$86,320
Interest Rate
5.75%
Mortgage Type
Purchase Money Mortgage
Estimated Equity
$306,043
Purchase Details
Closed on
Apr 29, 1999
Sold by
Winn John C and Winn Carol A
Bought by
Bugai Robert P and Vath Jennifer D
Home Financials for this Owner
Home Financials are based on the most recent Mortgage that was taken out on this home.
Original Mortgage
$96,000
Interest Rate
6.95%
Mortgage Type
Purchase Money Mortgage
Create a Home Valuation Report for This Property
The Home Valuation Report is an in-depth analysis detailing your home's value as well as a comparison with similar homes in the area
Home Values in the Area
Average Home Value in this Area
Purchase History
| Date | Buyer | Sale Price | Title Company |
|---|---|---|---|
| Klein William A | $224,500 | -- | |
| Bugai Robert P | $128,000 | -- | |
| Klein William A | $224,500 | -- | |
| Bugai Robert P | $128,000 | -- |
Source: Public Records
Mortgage History
| Date | Status | Borrower | Loan Amount |
|---|---|---|---|
| Open | Bugai Robert P | $179,600 | |
| Closed | Bugai Robert P | $44,900 | |
| Closed | Bugai Robert P | $179,600 | |
| Previous Owner | Bugai Robert P | $96,000 |
Source: Public Records
Tax History
| Year | Tax Paid | Tax Assessment Tax Assessment Total Assessment is a certain percentage of the fair market value that is determined by local assessors to be the total taxable value of land and additions on the property. | Land | Improvement |
|---|---|---|---|---|
| 2025 | $5,296 | $171,990 | $61,600 | $110,390 |
| 2024 | $5,172 | $171,990 | $61,600 | $110,390 |
| 2023 | $5,058 | $171,990 | $61,600 | $110,390 |
| 2022 | $4,587 | $137,620 | $58,940 | $78,680 |
| 2021 | $2,823 | $137,620 | $58,940 | $78,680 |
| 2020 | $4,518 | $137,620 | $58,940 | $78,680 |
| 2019 | $4,518 | $137,620 | $58,940 | $78,680 |
| 2018 | $4,518 | $137,620 | $58,940 | $78,680 |
| 2017 | $4,026 | $118,670 | $50,590 | $68,080 |
| 2016 | $3,991 | $118,670 | $50,590 | $68,080 |
| 2015 | $3,724 | $118,670 | $50,590 | $68,080 |
| 2014 | $3,949 | $118,670 | $50,590 | $68,080 |
Source: Public Records
Map
Nearby Homes
- 32 Lincoln Rd
- 23 Crest Dr
- 28 & 33 River Rd
- 30 Larkspur Dr
- 180 Skyview Dr Unit 180
- 23 Primrose Ln
- 25 Primrose Ln
- 234 Skyview Dr Unit 234
- 27 Primrose Ln
- 1 Great Oak Ct
- 29 Primrose Ln
- 9 Bayberry Ct
- 10 Dogwood Ct Unit 10
- 9 Willow Ct
- 22 Linda Ct Unit 22
- 7 Willow Ct Unit 7
- 21 Hawthorn Ct Unit 21
- 8 Cortland Way
- 14 Redwood Ct Unit 14
- 159 Evergreen Rd
Your Personal Tour Guide
Ask me questions while you tour the home.